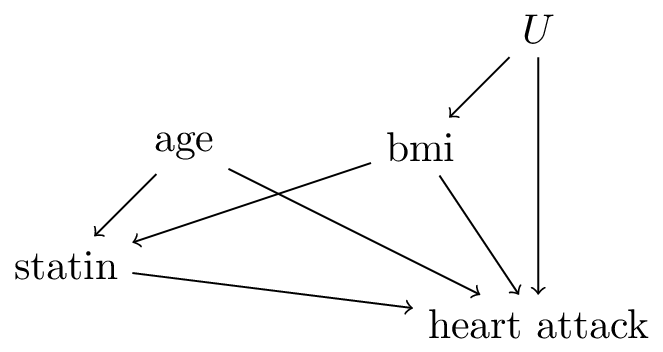
Correct interpretation of prediction models
Researchers built a prediction model \(f\) that aims to predict the risk of a heart attack (\(=Y\)) conditional on features \(X=\{\)age,bmi\(\}\) when intervening on treatment \(T=\)statin (assumed to be a binary variable). Assume that the model was fit on a sufficiently large training set without parametric form bias. In addition, assume this DAG:
These numbers are produced by the model \(f\):
| 1 |
50 |
20 |
10% |
| 0 |
50 |
20 |
15% |
| 1 |
50 |
25 |
20% |
| 0 |
50 |
25 |
18% |
| 1 |
55 |
25 |
23% |
| 0 |
55 |
25 |
21% |
Read the following statements:
- for a patient of age=50 and bmi=25 who is not using a statin, the causal effect of reducing bmi by 5 points is a risk reduction of 18-15=3%
- for a patient of age=50 and bmi=20 who is not using a statin, the causal effect of starting a statin is a risk reduction of 15-10=5%
- for a patient of age=50, reducing bmi from 25 to 20 causes the effect of statins to become smaller on an absolute risk scale.
- for a patient with a bmi of 25 who is taking a statin, the causal effect of aging by 5 years is an increase in risk of 3%
answer: 2 is correct.
- is incorrect as this is not the causal effect due to the unobserved confounder \(u\) (age,statin) is not a sufficient adjustment set for the effect of bmi on heart attack.
- From the DAG we see that causal effect of statin is identified, as adjustment set (age,bmi) satisfies the backdoor rule (all backdoor paths are closed).
- is incorrect because the change in effect of statin for different levels of bmi does not in itself have a causal interpretation
- The total causal effect for age could be estimated from the data using adjustment set (bmi), but statin is a mediator from age to heart attack so (bmi,statin), which is used by \(f\), is not a valid adjustment set, so 4 is incorrect.
Validation of prediction models
Pre and post-deployment validation of prediction models
Researchers built a prediction model to identify patients with a high risk of developing sepsis in the hospital, a life-threatening disease. The prediction model uses the patient’s age, temperature and and blood pressure, and had good discriminative performance in the training data. The model is deployed, doctors are alerted of high risk patients and are able to prevent 90% of sepsis cases in this high risk group compared to before deployment of the model, so it is a glaring success. Post-deployment, a follow-up study is conducted to test if the model is still predicting accurately.
Answer: discrimination has gone down.
Reason: pre-deployment, the model had good discrimation which means that the risk of sepsis is markedly higher in the ‘high risk’ group compared to the low risk group. Deploying the model lead to better treatment of the high risk group, substantively reducing the risk of sepsis. Now, the ‘high risk’ and ‘low risk’ groups are much closer together in terms of rates of sepsis. As a consequence, the discriminative performance of the model has gone down.
Answer: Decreased discrimination is a sign of a succesful deployment, as the goal was to reduce the risk in the high-risk patients.
Answer: a cluster randomized trial, where some (groups of) doctors are randomized to have access to the model and others are not
see also the lecture
Selecting models for decision support
Researchers from the Netherlands developed two models for 10-year cardiovascular disease: Zrisk and Brisk. The intended use of the models is to better prescribe an expensive cholesterol lowering drug: go-lesterol. Both models use go-lesterol as an input variable, but each has a different set of other co-variates. Both models were trained on the same large observational dataset, and were tested in two external studies:
- A Nationwide registry in Sweden on the entire population (10 million people, 100.000 cases of heart attack during 5-year follow-up)
- An RCT with 2000 participants where go-lesterol was assigned randomly, 10 year follow-up and 50 heart attack cases
The results on AUC (a measure of discrimination between 0.5 and 1, where higher means better) are a bit puzzling:
| Sweden |
0.7 |
0.85 |
<0.00001 |
| RCT |
0.72 |
0.65 |
0.032 |
Assume that Sweden and the Netherlands are comparable in terms of health care and heart attack rates.
Answer: Brisk.
The training data and the Sweden study come from the same distribution as by assumption the countries are comparable (note also that in both studies the treatment is not assigned by randomization). The training dataset was large, so on sufficiently large sample from the same distribution, both models will demonstrate the same performance
Answer: Zrisk. The goal of decision support models that include the targeted treatment (go-lesterol in this example) is to predict accurately under the hypothetical intervention of assigning that treatment. This means that the RCT samples from the target distribution, whereas the Swedish registry study does not.
Answer: a (cluster) RCT where either Brisk or Zrisk is used. Hypothetical study design: require doctors to fill in information on both covariate sets so that the Zrisk and Brisk scores can both be computed. On a per-patient basis, randomly report the result from Zrisk or Brisk, without reporting what model provided the risk-estimate (this design assumes that the Zrisk and Brisk models are sufficiently complex that the doctors will not be able to guess which model is providing the prediction). After sufficient follow-up time, measure whether Zrisk or Brisk has lower rates of heart attacks.
Also possible: use Zrisk and Brisk as potential policies in the RCT, subset the patients to either those whose randomly allocated treatment is concordant with Zrisk or Brisk, and calculate which subgroup has the lowest rate of heart attacks.
see also the lecture
Other uses of causality in prediction modeling
Researchers developed a deep learning model that detects heart attacks on an ECGs. They used ECGs from both the emergency room as well as out-patient clinic ECGs. The emergency room has a different type of ECG machine than the out-patient clinic, and heart attacks are much more frequent in the emergency room than in the out-patient clinic. By conducting model interpretability studies, researchers found that the deep learning model can recognize whether an ECG is from the out-patient clinic or the emergency room, and in fact uses this information in its prediction. This finding is explained to the cardiologist, who says that the model is not ‘robust’, that this should be fixed or the model cannot be used.
Answer: it depends. Indeed, the model uses non-causal (or ‘spurious’) information to create a prediction. This will create problems when this information is unreliable, for example because the ECG-machines may be swapped between the emergency room and out-patient clinic at any time. However, as long as the same ECG-machines stay in place, there is no fundamental issue in using this information in the prediction. In fact, including where the ECG was made (emergency vs out-patient) would be a good feature to include in any prediction model for heart attacks, be it a deep learning model or any other prediction model type.