Causality in Prediction Research & Target Trial Emulation

AI methods lab seminar

Wouter van Amsterdam

2025-12-01

Today’s program

  • Wouter van Amsterdam: mini tutorial in confounding and causal inference
  • Oisín Ryan: Target Trial Emulation for vaccine safety studies
  • Steven Hageman: Prediction models for Cardiovascular Risk management
  • Lotta Meijerink: Prediction models for treatment decisions in Radiotherapy

Predictions and associations

“What to expect when we passively observe the world”

What are causal questions?

Questions with an element of ‘what if’

What will happen if we treat all patients with A (versus B)?

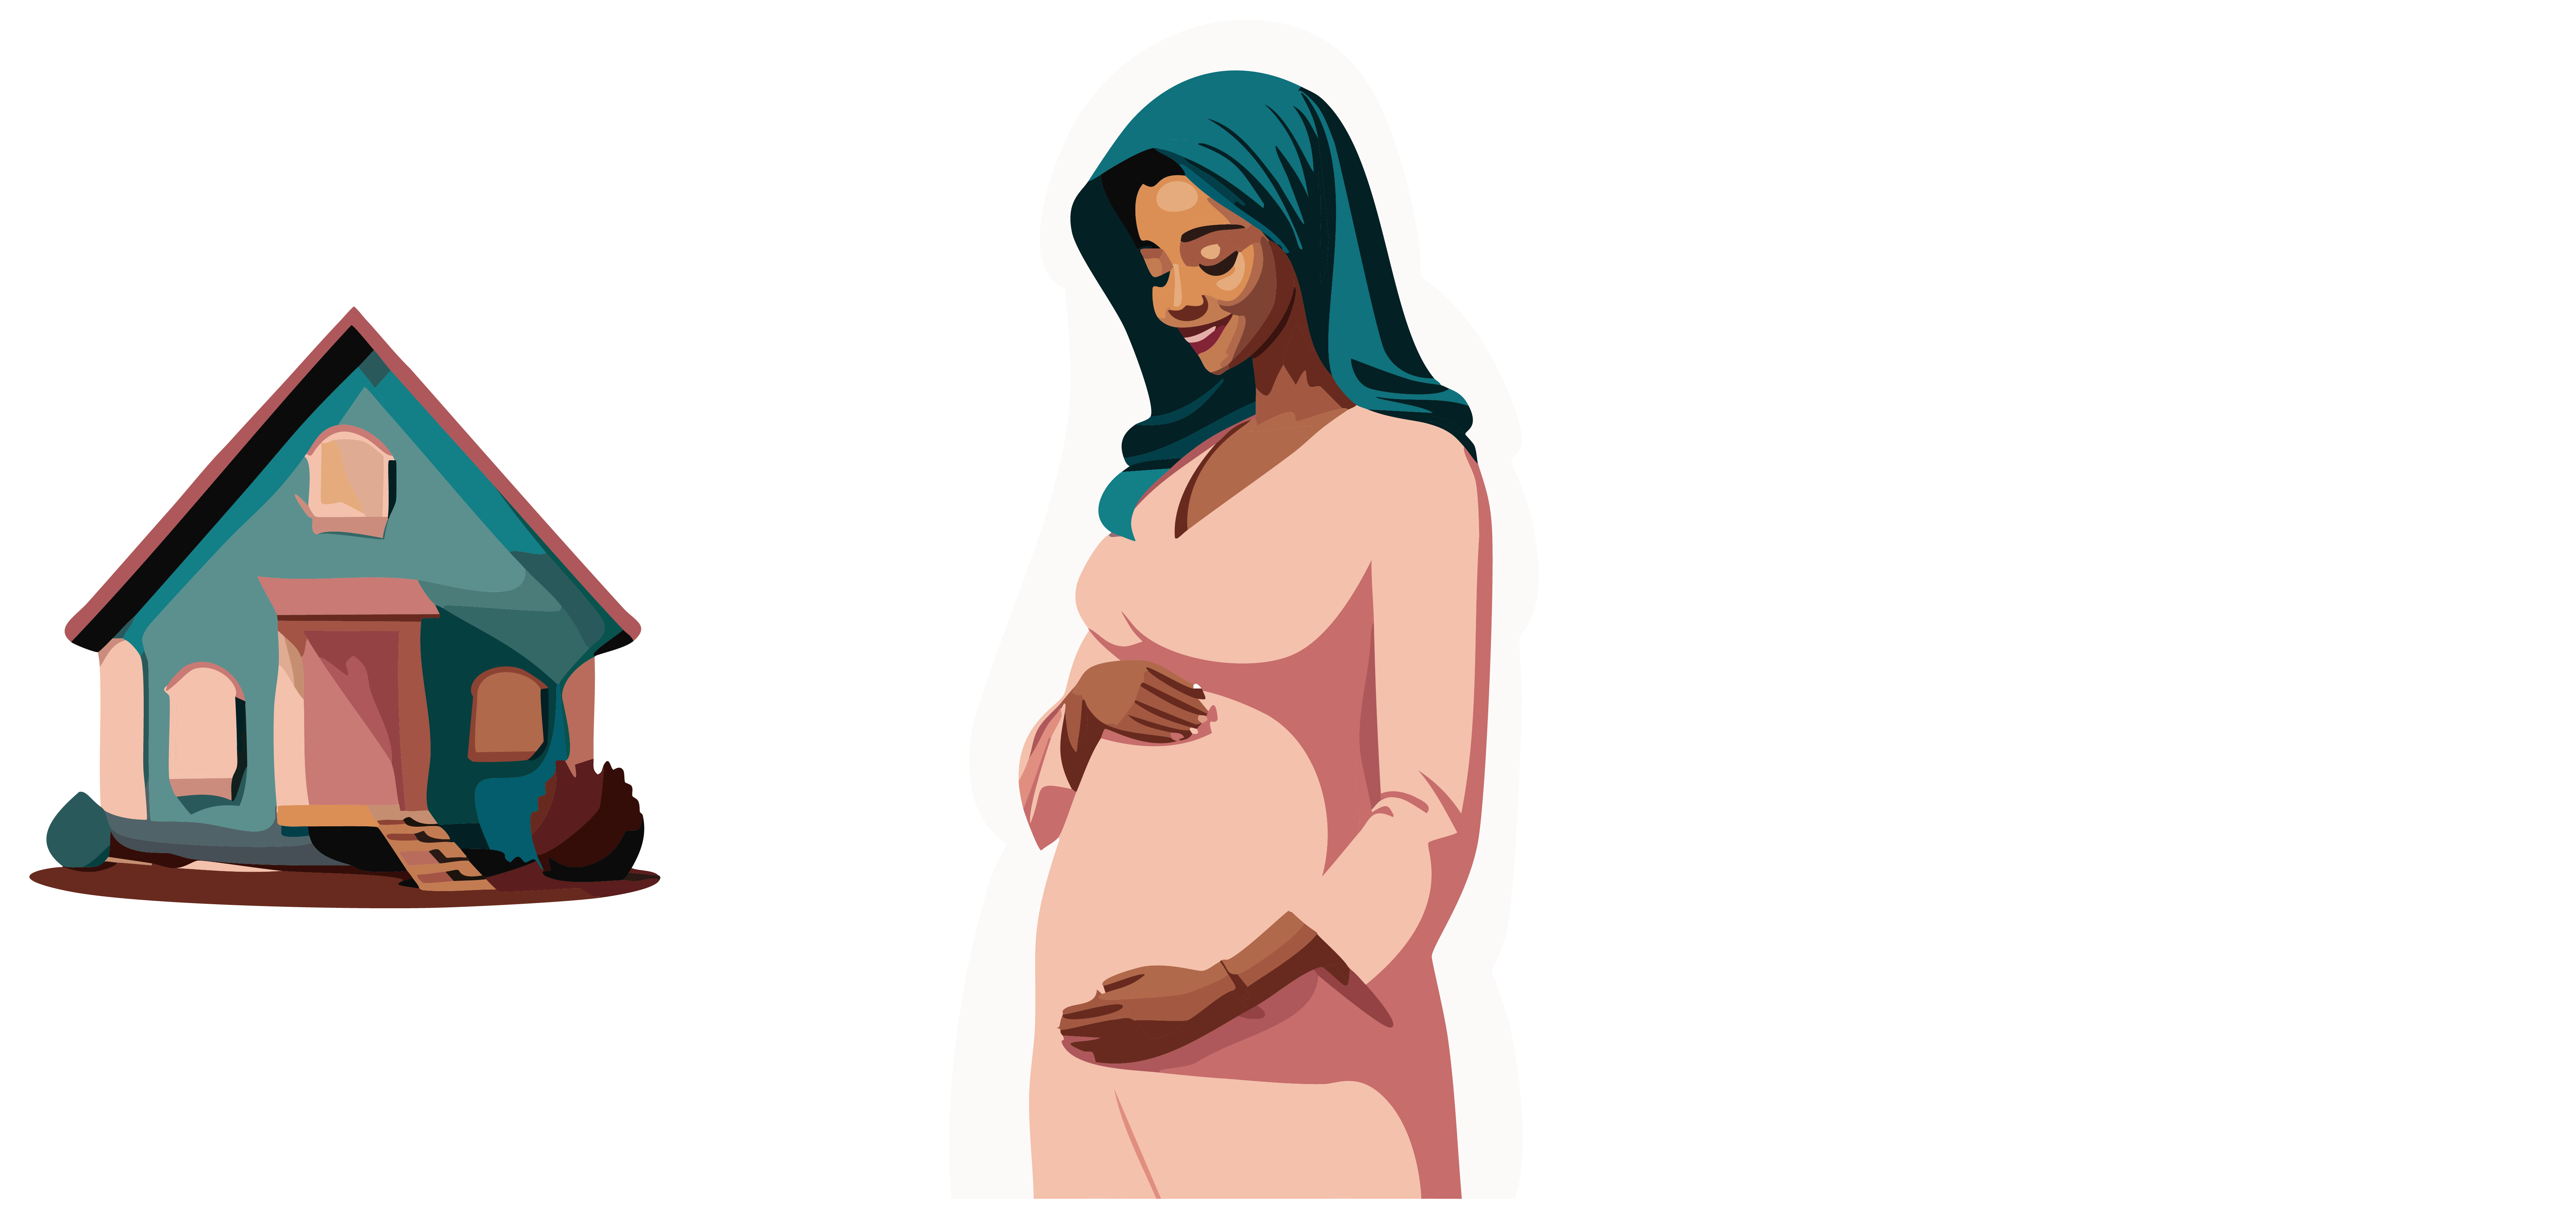
What if we send all babies to the hospital for delivery?

Home delivery versus hospital delivery

  • You’re a data scientist in a children’s hospital
  • Have data on
    • delivery location (home or hospital)
    • neonatal outcomes (good or bad)
    • pregnancy risk (high or low)
  • Question: if we send all deliveries to the hospital, will neonatal outcomes improve?

Observed data

percentage of good neonatal outcomes
location
home hospital
risk low 648 / 720 = 90% 19 / 20 = 95%
  • better outcomes for babies with low risk when delivered in the hospital

Observed data

percentage of good neonatal outcomes
location
home hospital
risk low 648 / 720 = 90% 19 / 20 = 95%
high 40 / 80 = 50% 144 / 180 = 80%
  • better outcomes for babies delivered in the hospital for both risk groups
  • between 5% and 30% better

Observed data

location
home hospital
risk low 648 / 720 = 90% 19 / 20 = 95%
high 40 / 80 = 50% 144 / 180 = 80%
marginal 688 / 800 = 86% 163 / 200 = 81.5%
  • better outcomes for babies delivered in the hospital for both risk groups
  • but not better marginal (‘overall’)
  • how is this possible?
  • what is the correct way to estimate the effect of delivery location?

Causal Directed Acyclic Graphs

diagram that represents our assumptions on causal relations

  1. nodes are variables
  2. arrows (directed edges) point from cause to effect

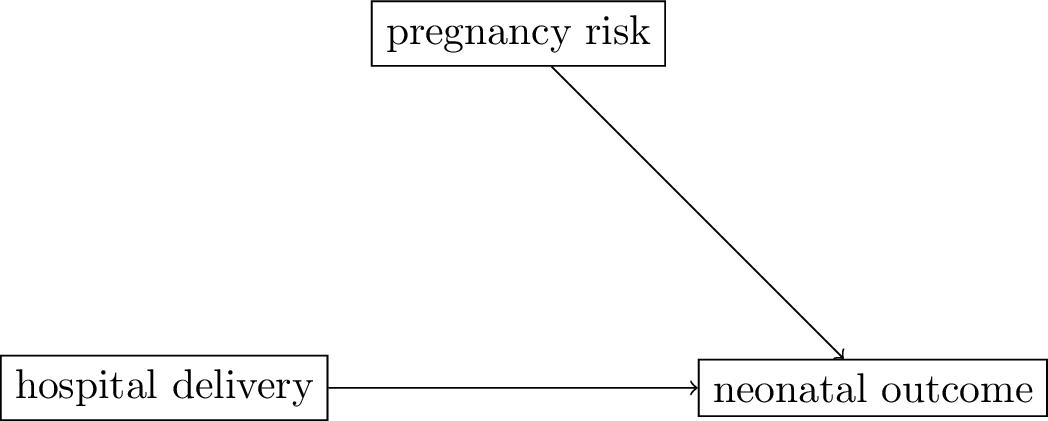
Making a DAG for our example:
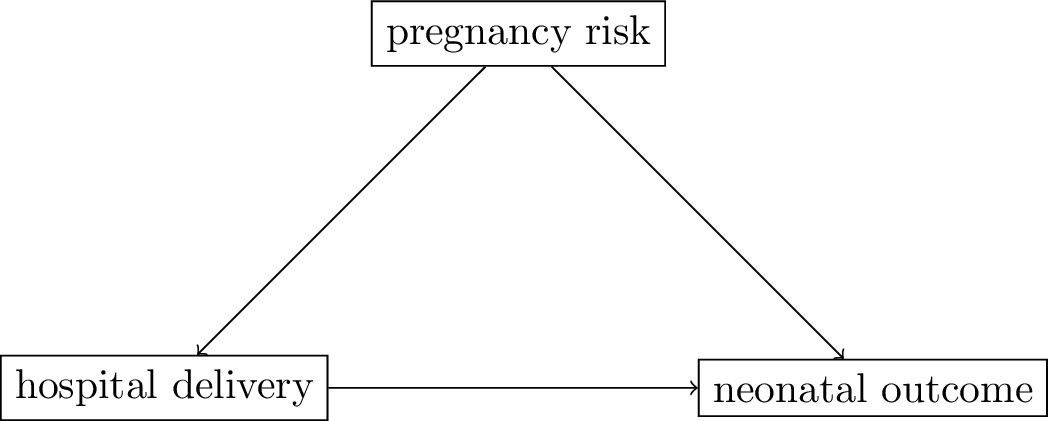
  • assumptions:
    • women with high risk of bad neonatal outcomes (pregnancy risk) are referred to the hospital for delivery
    • hospital deliveries lead to better outcomes for babies as more emergency treatments possible
    • both pregnancy risk and hospital delivery cause neonatal outcome
  • the other variable pregnancy risk is a common cause of the treatment (hospital delivery) and the outcome (this is called a confounder)

Intervention as graph surgery

  • Our question: what if we send all deliveries to the hospital?
  • In this hypothetical world, all deliveries (low risk and high risk) go to hospital (or home)
  • Can be observed in a Randomized Controlled Trial (RCT)
  • In the DAG: the arrow from pregnancy risk to hospital delivery should be removed

Using DAGs to identify causal effects

  • in our example, we can calculate the causal effect of hospital delivery on neonatal outcome by looking at the effect within levels of pregnancy risk
  • this is an example of a broader theme:
    • we have non-experimental (observational) data
    • would like to answer a question about an intervention, as we would observe in a randomized trial
    • causal inference toolbox: express assumptions on our data
    • derive how to estimate the causal effect from observational data (covariate adjustment, inverse probability weighting, etc)

Today’s program

  • Wouter van Amsterdam: mini tutorial in confounding and causal inference
  • Oisín Ryan: Target Trial Emulation for vaccine safety studies
  • Steven Hageman: Prediction models for Cardiovascular Risk management
  • Lotta Meijerink: Prediction models for treatment decisions in Radiotherapy