A causal viewpoint on prediction model performance under changes in case-mix

Human Data Science ‘Content Meeting’

Wouter van Amsterdam, MD PhD

2025-05-22

Motivation

  • clinicians use prediction models for medical decisions, e.g.
    • making a diagnosis:
      1. observe symptoms (paralysis)
      2. try to infer the cause (diagnosis = stroke)
    • estimating a patients prognosis
      1. observe patient features / risk factors (cholesterol, age)
      2. predict future outcomes (heart attack)
  • these prediction models need reliable performance
  • issue: potential substantive difference between last evaluation and current use

Change in setting

What can we expect from the model’s performance (if anything) in the new setting?

model trained / evaluated in tertiary care hospital

model used in GP setting

This paper / talk

  • recap performance: discrimination, calibration
  • look at the causal direction of the prediction:
    • are we predicting an effect based on its causes (e.g. heart attack, based on cholesterol and age) - typical in prognosis
    • are we predicting a cause based on its effects (infer presence of CVA based on neurological symptoms) - typical in diagnosis
  • define shift in case-mix as a change in the marginal distribution of the cause variable
  • conclude that in theory:
    • for prognosis models: expect stable calibration, not discrimination
    • for diagnosis models: expect stable discrimination, not calibration
  • illustrate with simulation
  • evaluate on 2030+ prediction model evaluations

Recap of performance metrics: discrimination and calibration

  • prediction model \(f: X \to [0,1]\) (i.e. predicted probability, e.g. logistic regression)
  • performance metric \(m_f: P(X,Y) \to R\)

Discrimination: sensitivity, specificity, AUC

  • take a threshold \(\tau\), such that \(f(x) > \tau\) is a positive prediction
  • tabulate predictions vs outcomes
outcome
1 0
prediction 1 true positives false positives
0 false negatives true negatives

Discrimination: sensitivity, specificity

outcome
1 0
prediction 1 true positives false positives
0 false negatives true negatives
sensitivity: TP / (TP+FN) specificity: TN / (TN+FP)
  • sensitivity: \(P(\hat{Y}=1 | Y=1)\)

    • \(=P(X \in \{X: f(X) > \tau \} | Y=1)\) (assuming deterministic \(f\))
  • specificity: \(P(\hat{Y}=0 | Y=0)\)

  • note: sensitivity only requires data from the column of postive cases (i.e. \(Y=1\)), and specificity on negatives

  • event-rate: fraction of \(Y=1\) of total cases

  • in theory discrimination is event-rate independent (Hond 2023)

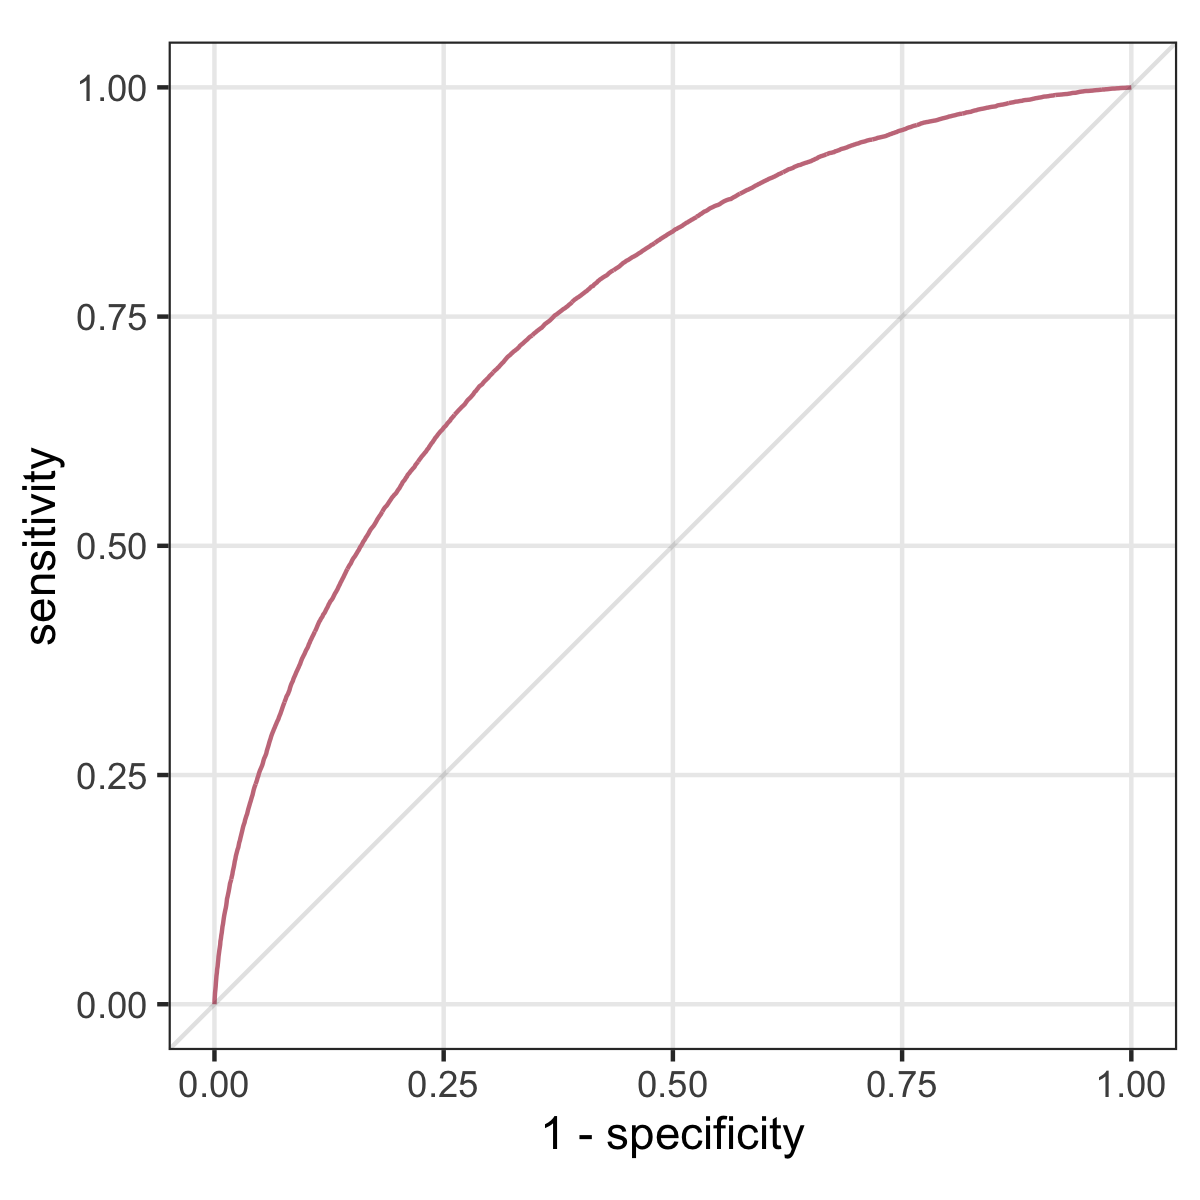
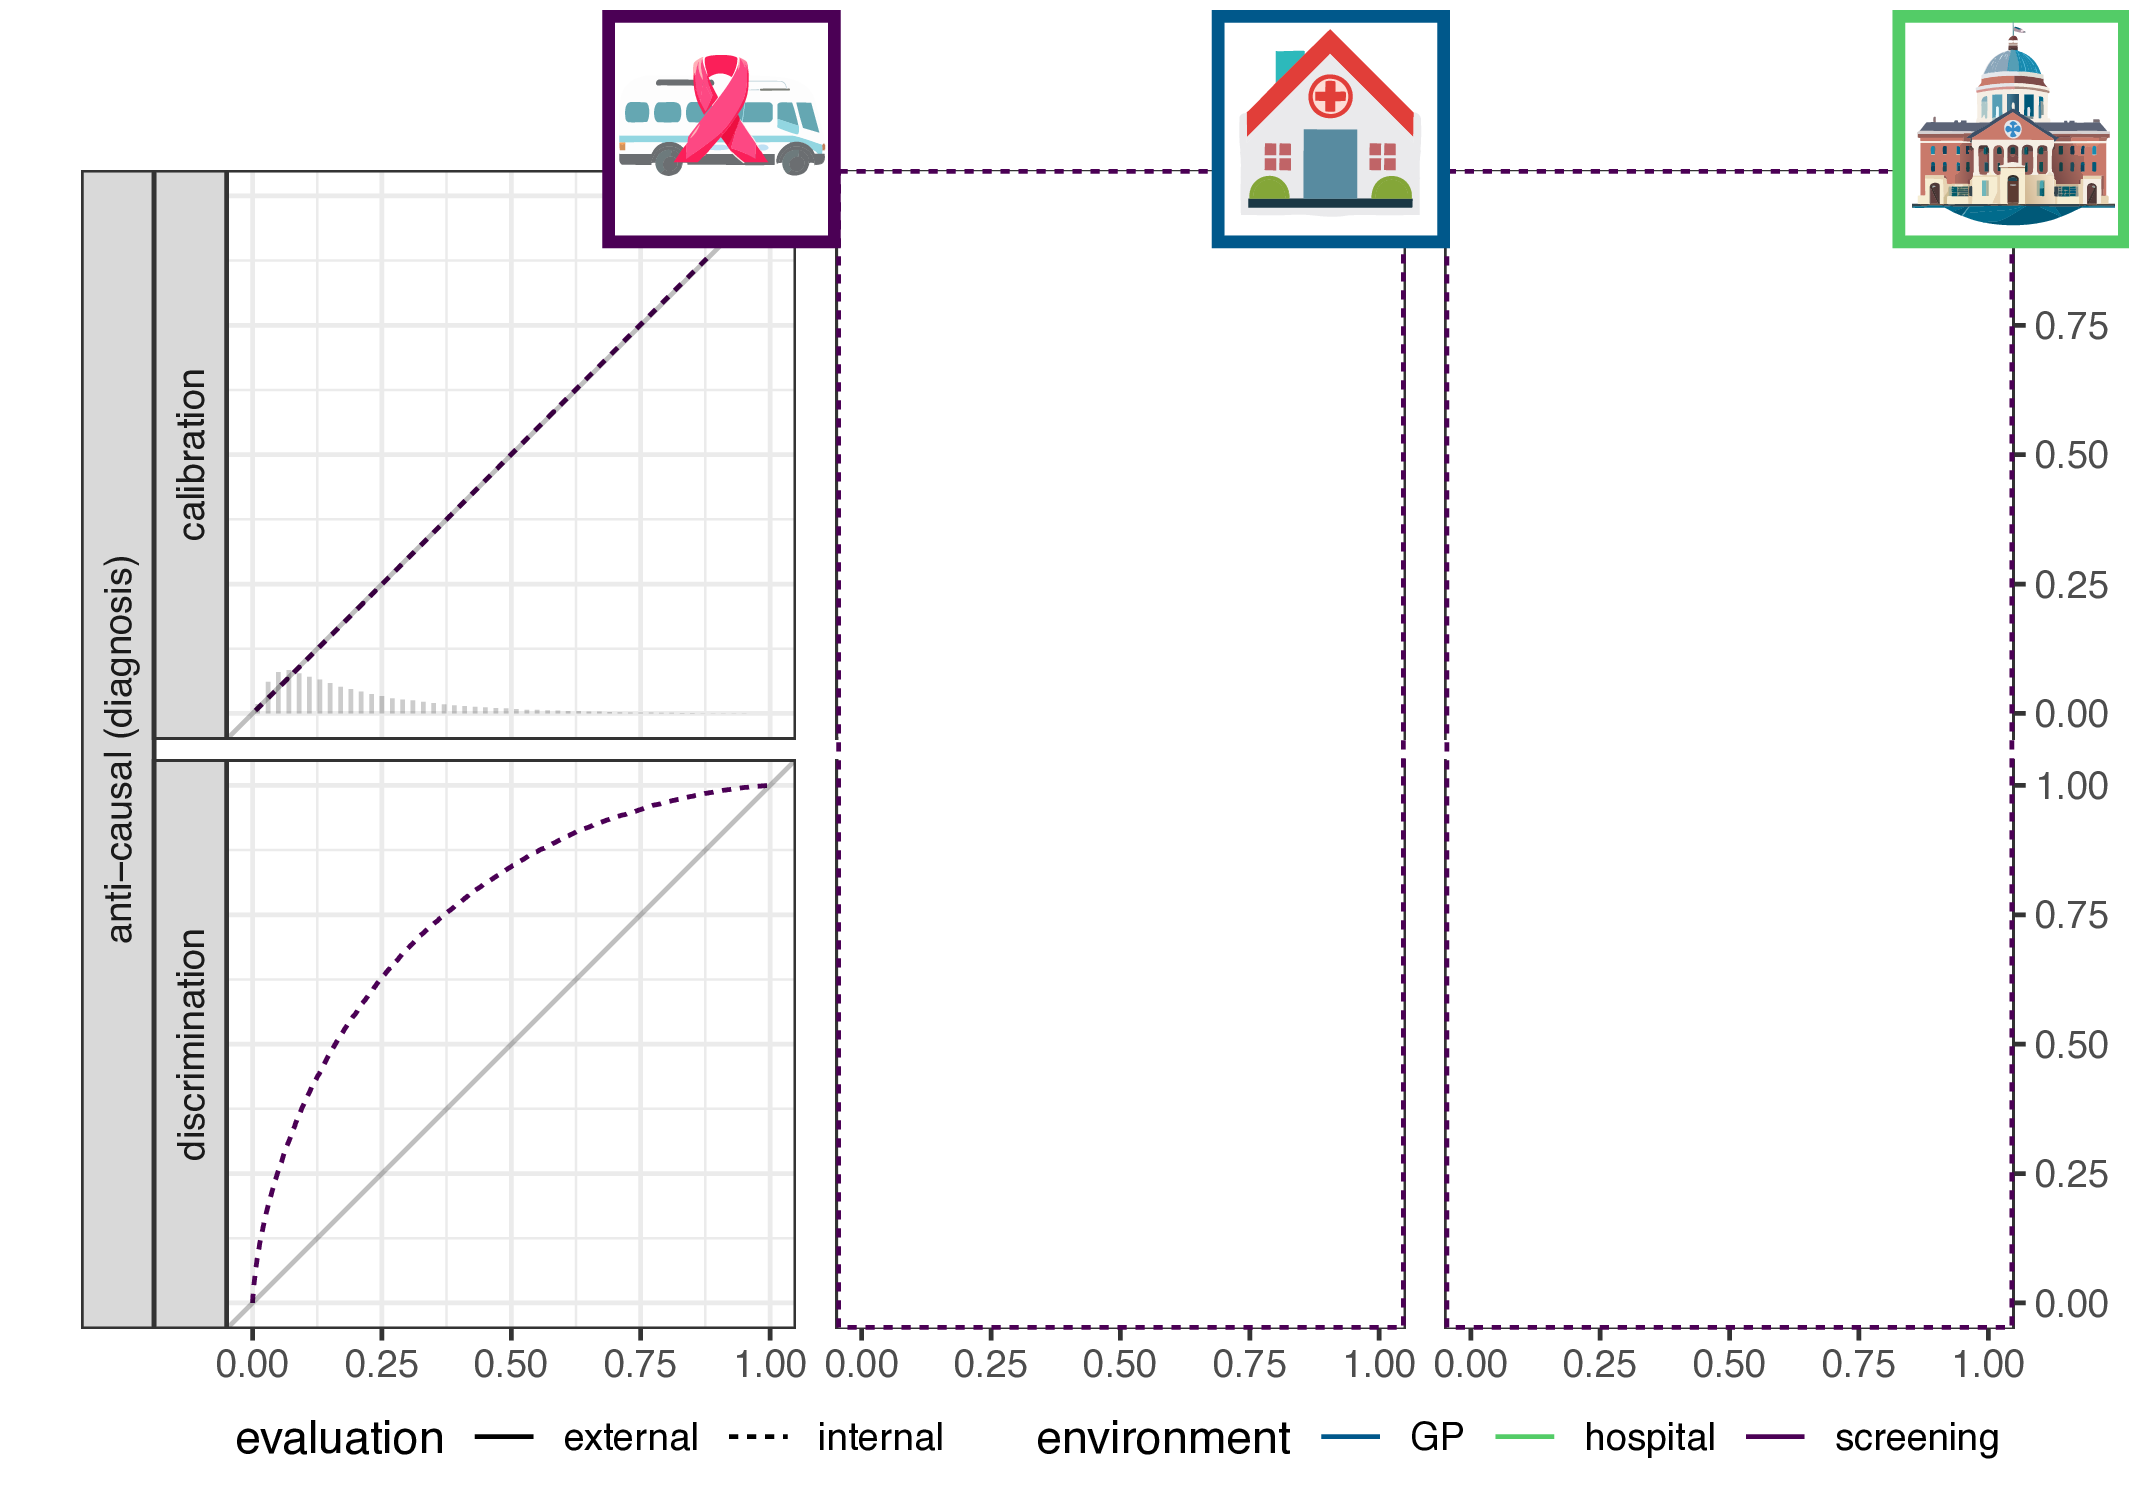
Discrimination: ROC curve and AUC

if we vary the threshold \(0 \leq \tau \leq 1\), we get a ROC curve, and the AUC is the area under this curve
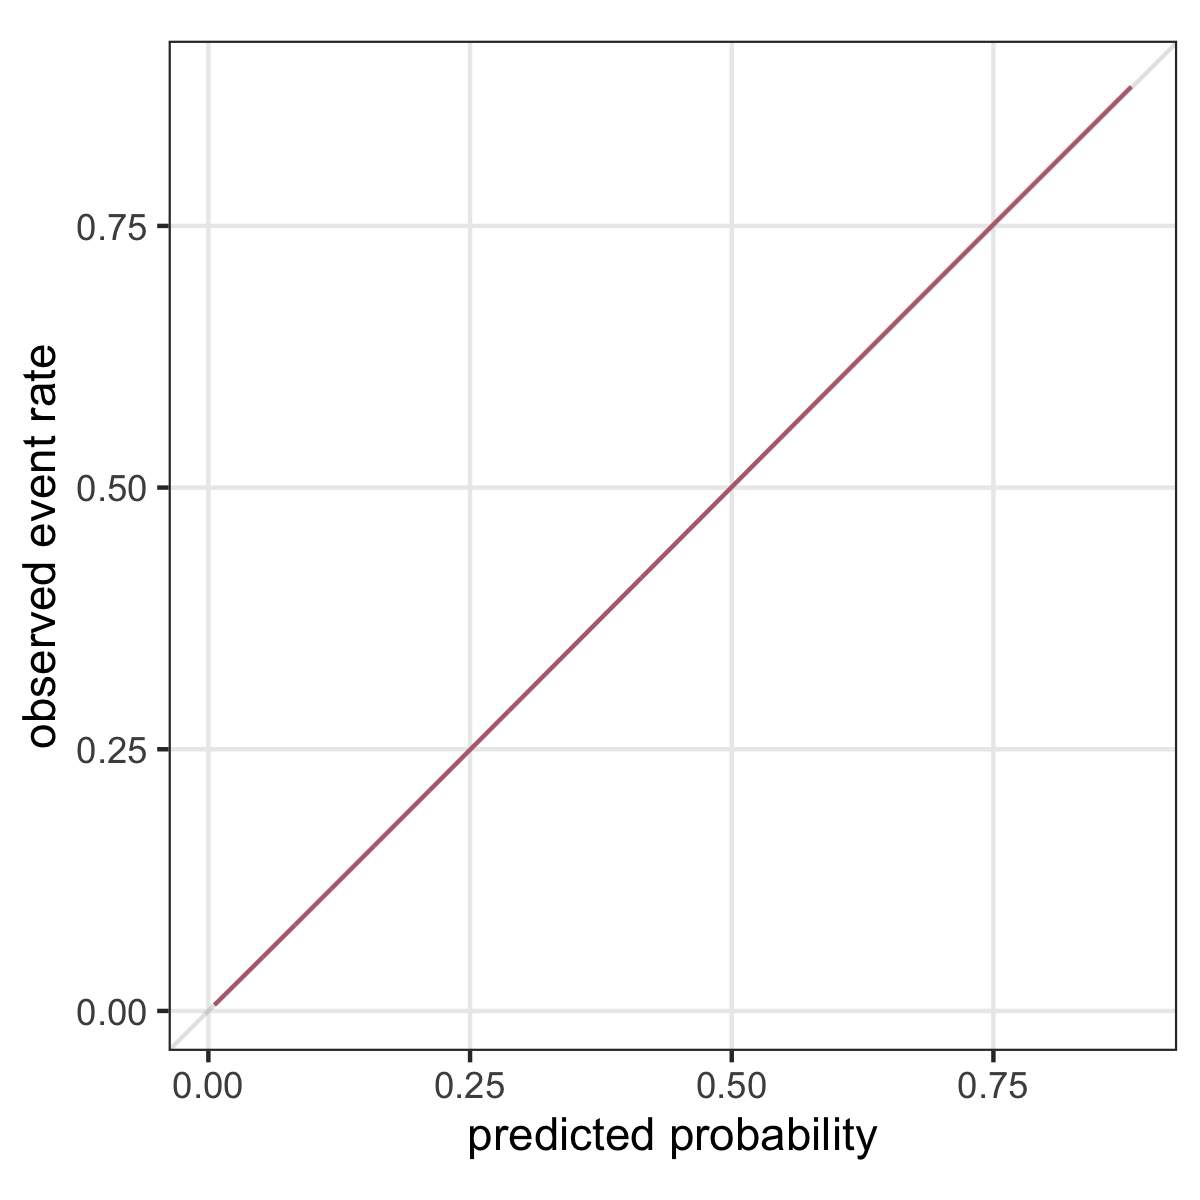
Calibration

“A model is said to be well calibrated if for every 100 patients given a risk of x%, close to x have the event.” (Van Calster and Vickers 2015)

population

subgroup where \(f(x)=10\)%

event rate in said subgroup is 10%: \(p(Y=1|f(x)=10\%) = 10\%\)

Calibration plot

\(p(Y=1|X)\) versus \(f(x)\)

calibration

calibration-plot

Performance metrics summary

  • performance metrics for \(f\) are ingeneral functionals of the joint distribution \(P(X,Y)\)
  • discrimination: function of conditional \(P(X|Y)\) (features given outcome)
  • calibration: function of conditional \(P(Y|X)\) (outcome given features)

A causal description of shifts in case-mix

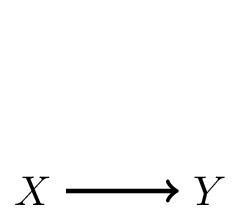
Where does the association come from?

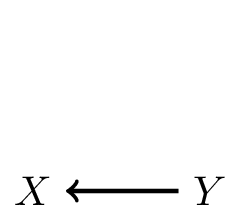
In prediction, we have features \(X\) and outcome \(Y\) and model \(Y|X\)

1. \(X\) causes \(Y\): often in prognosis (\(Y\): heart-attack, \(X\): cholesterol and age)

2. \(Y\) causes \(X\): often in diagnosis (CVA, based on neurological symptoms)

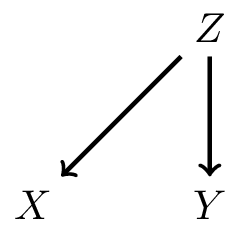
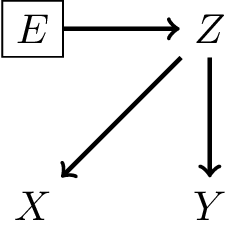
3. \(Z\) causes both \(X\) and \(Y\): confounding (yellow fingers predict lung cancer)

Defining a shift in case-mix

Define a shift in case-mix a change in the marginal distribution of the cause variable. Denoting environment as variable \(E\):

  • pregnancy outcome prediction
    1. general ‘midwife’ population
    2. pregnant women with type 1 diabetes are counselled by gynaecologists in hospital
    • this is filtering on patient characteristics (making distribution of \(X\) different)
  • predict occurence of STD
    1. general emergency center
    2. patients with clear neurological symptoms are sent to stroke center
    • filter on outcome risk (different distribution of \(Y\))

What does this definition imply?

  • in general, may decompose \(P(X,Y,E)\) as:
    1. \(P(Y|X,E)P(X,E)\)
    2. \(P(X|Y,E)P(Y,E)\)
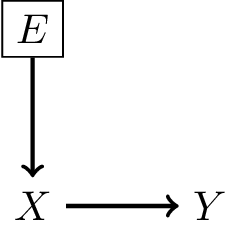
  • looking at the DAG: \(P(Y|X,E) = P(Y|X)\)
    • in words: \(P(Y|X)\) is transportable across environments
    • because there is no arrow from \(E\) to \(Y\), \(X\) blocks effect of \(E\) on \(Y\)
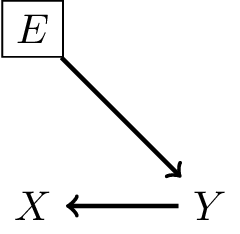
  • \(P(X|Y,E) \neq P(X|Y)\)
    • in words: \(P(X|Y)\) is not transportable across environments
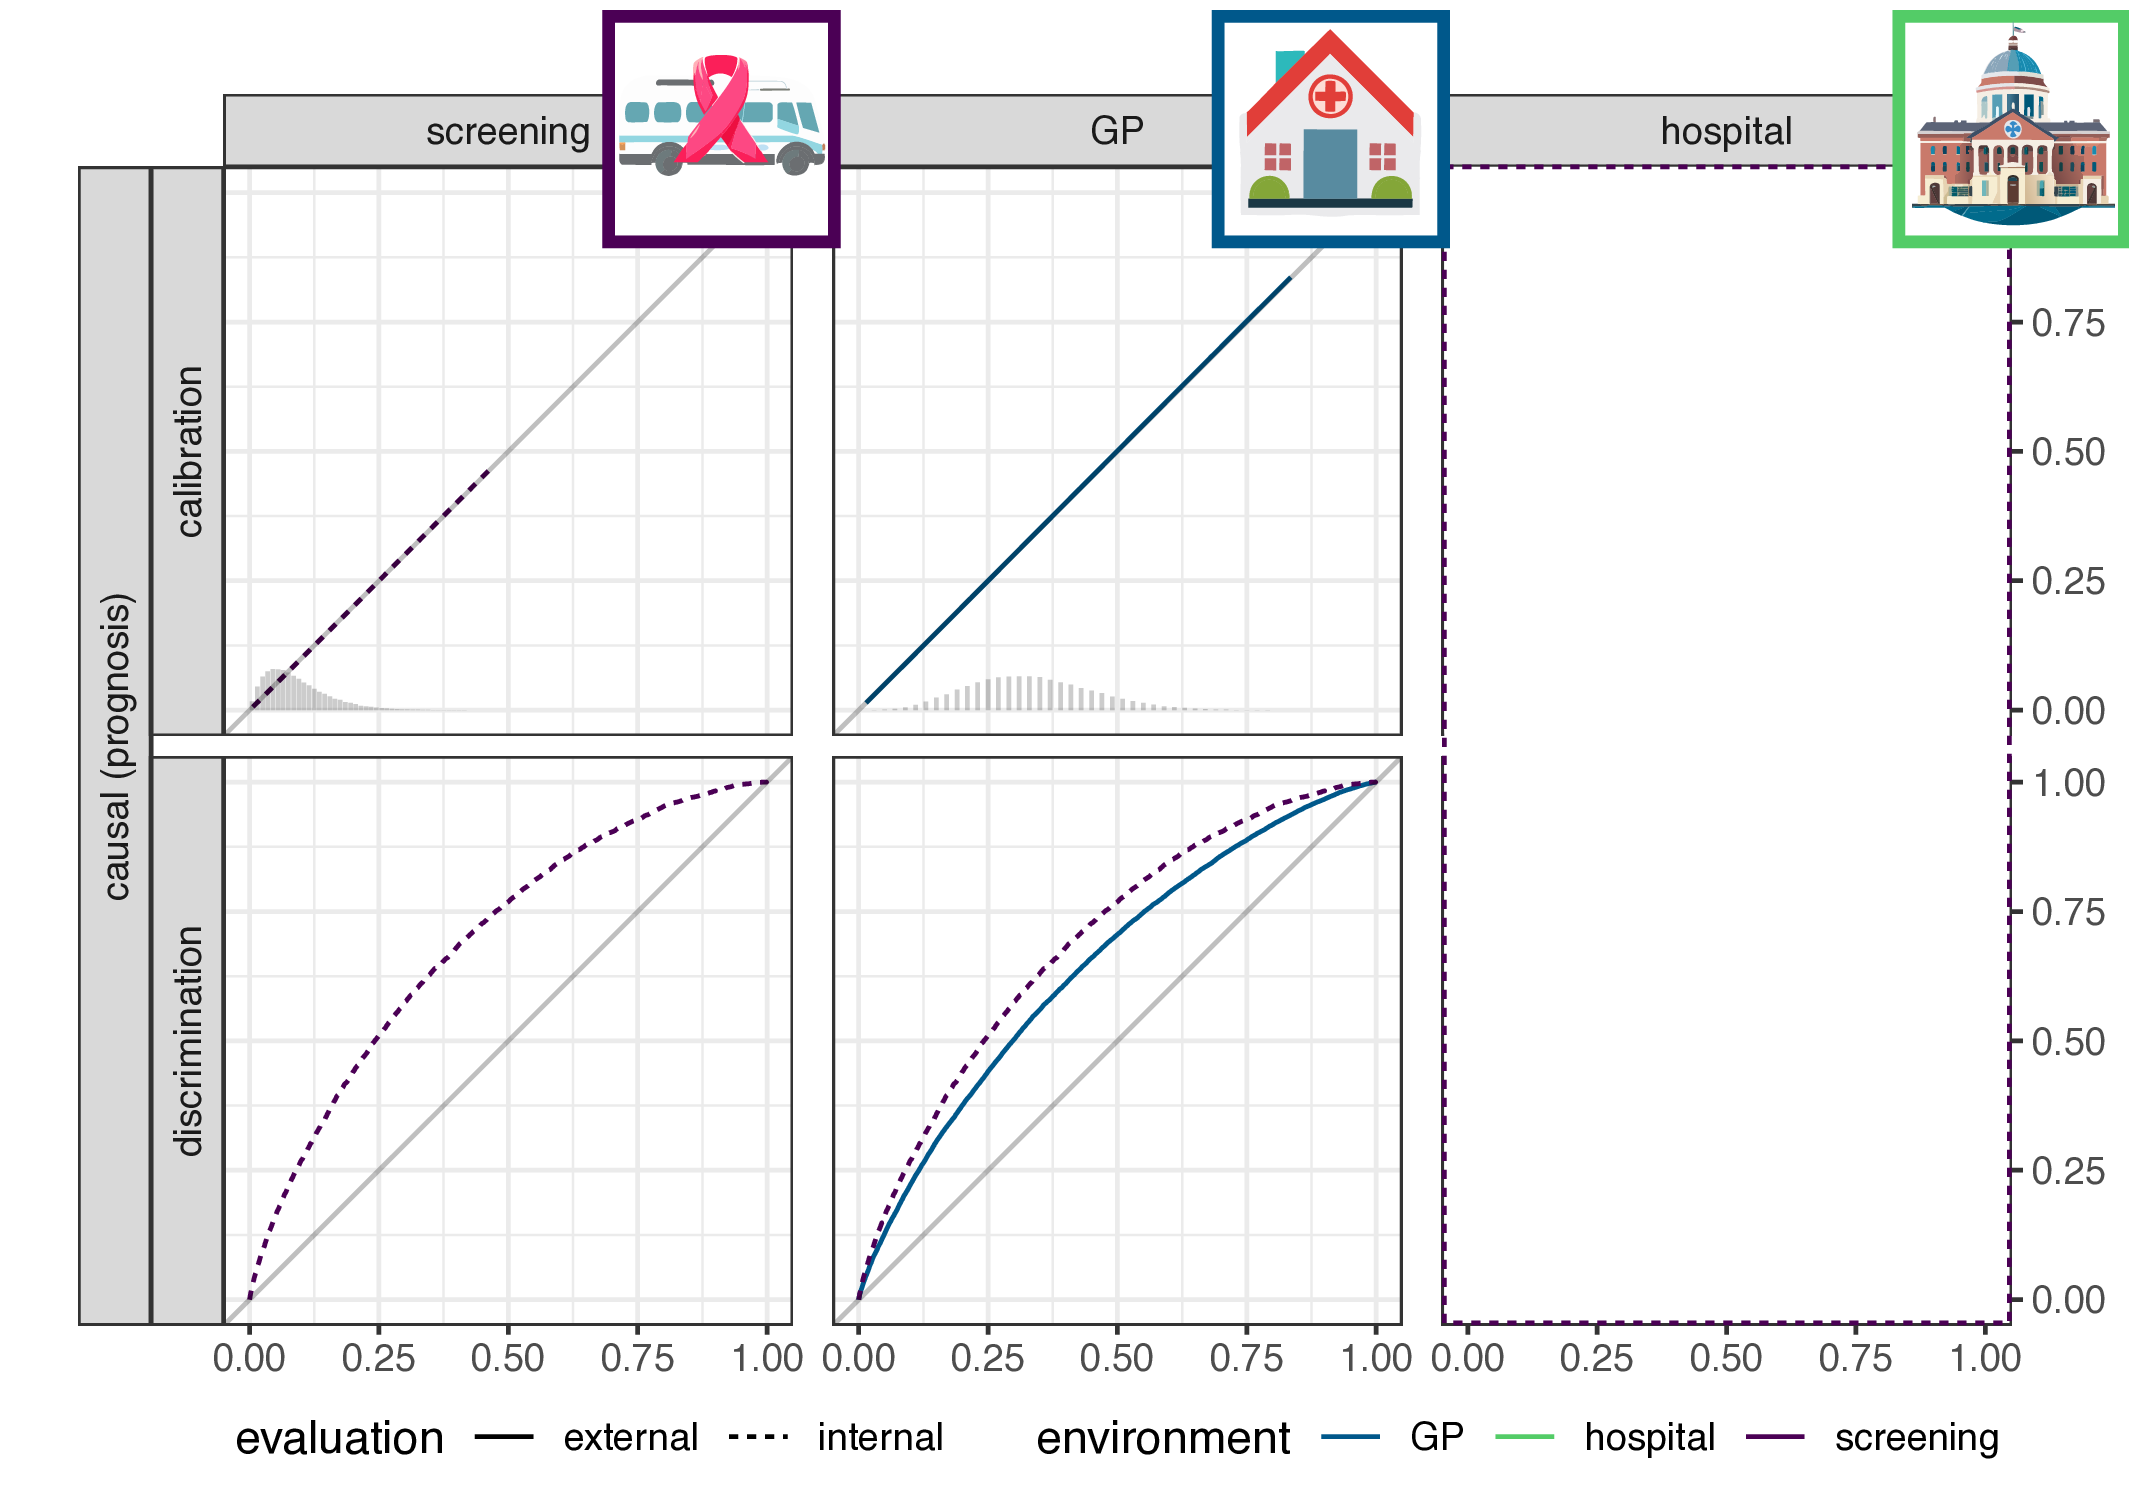
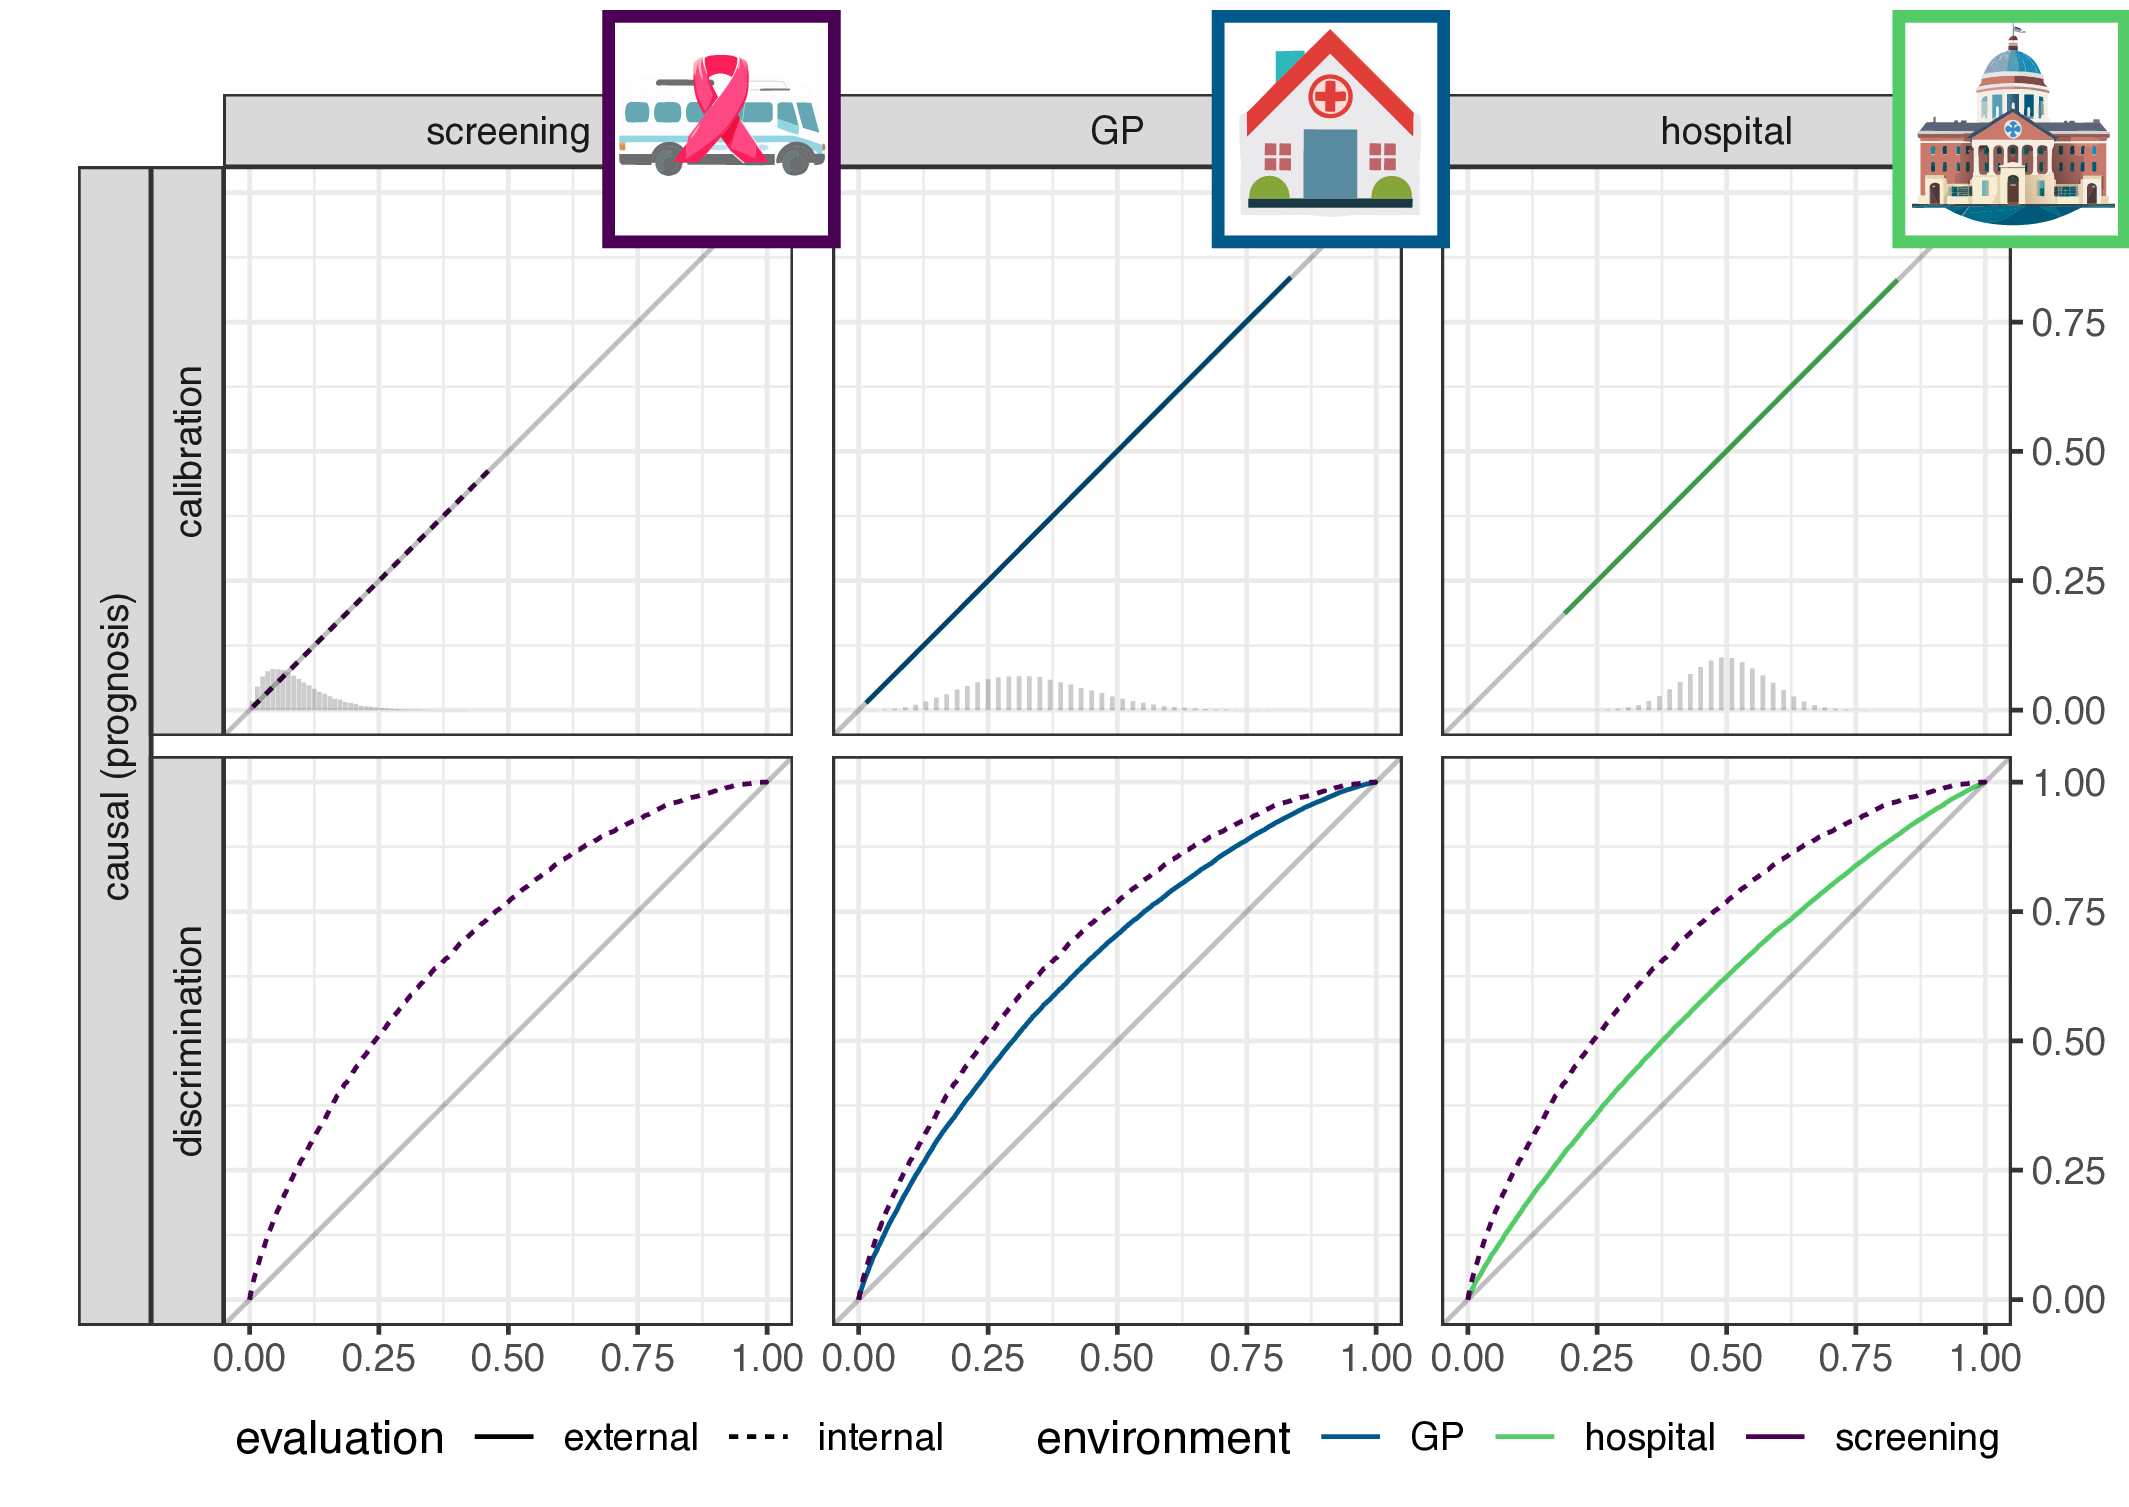
  • implication for causal (prognosis) prediction:
    • calibration is functional of \(P(Y|X)\), thus stable
    • discrimination is functional of \(P(X|Y)\), thus not stable
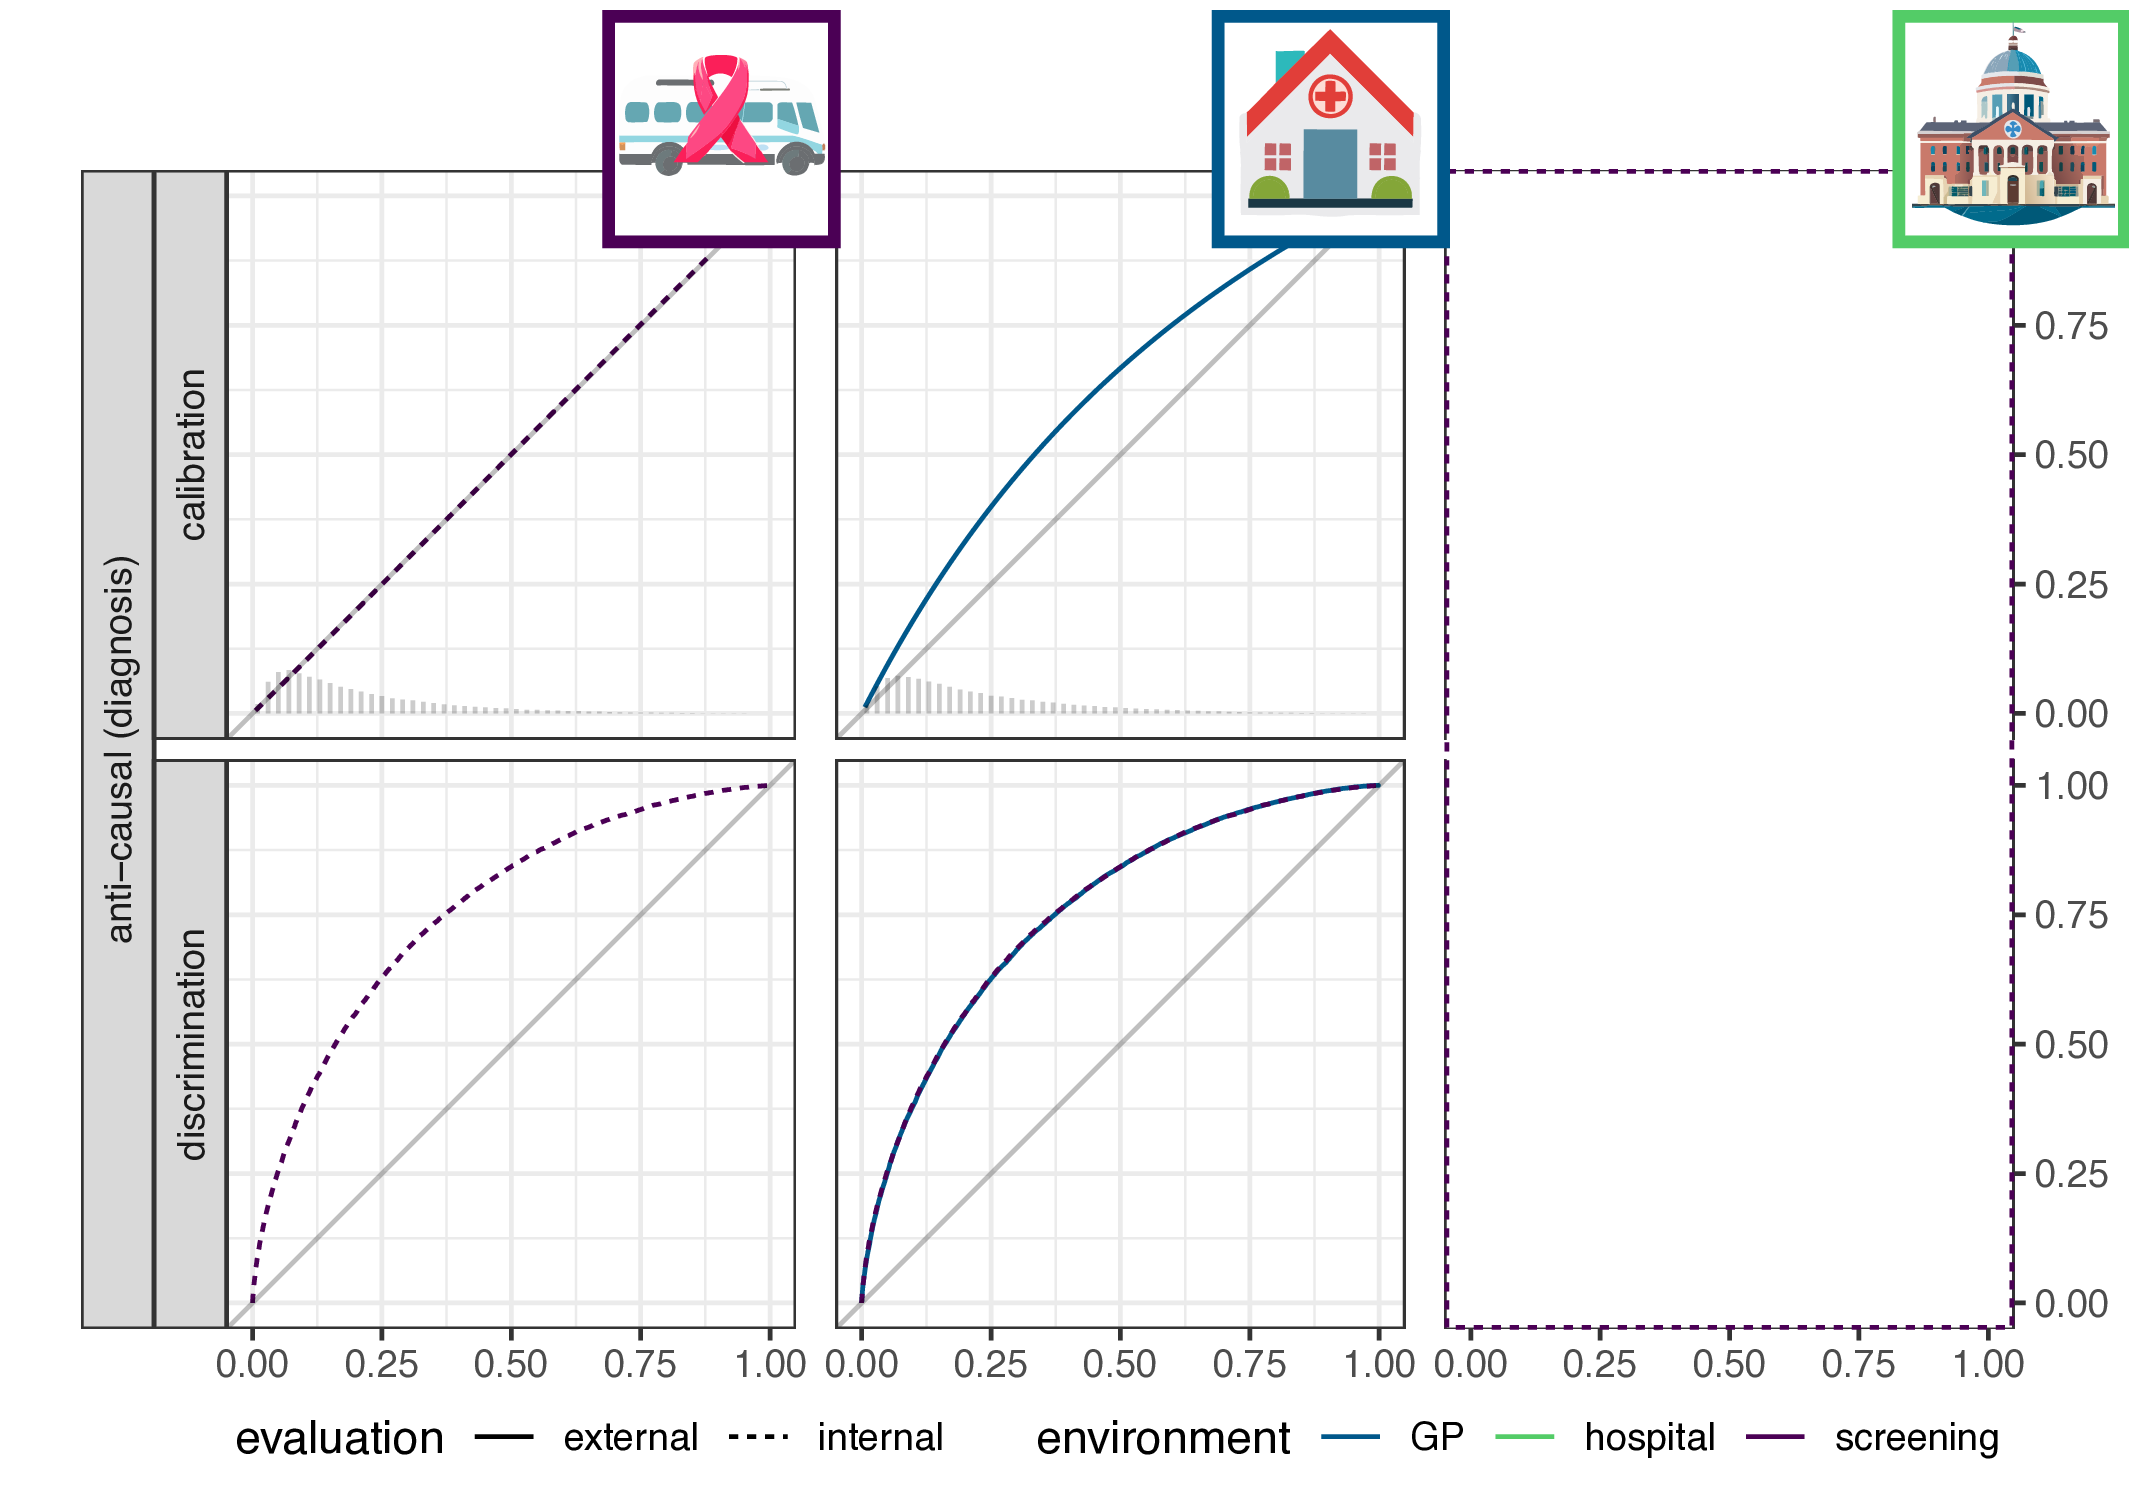
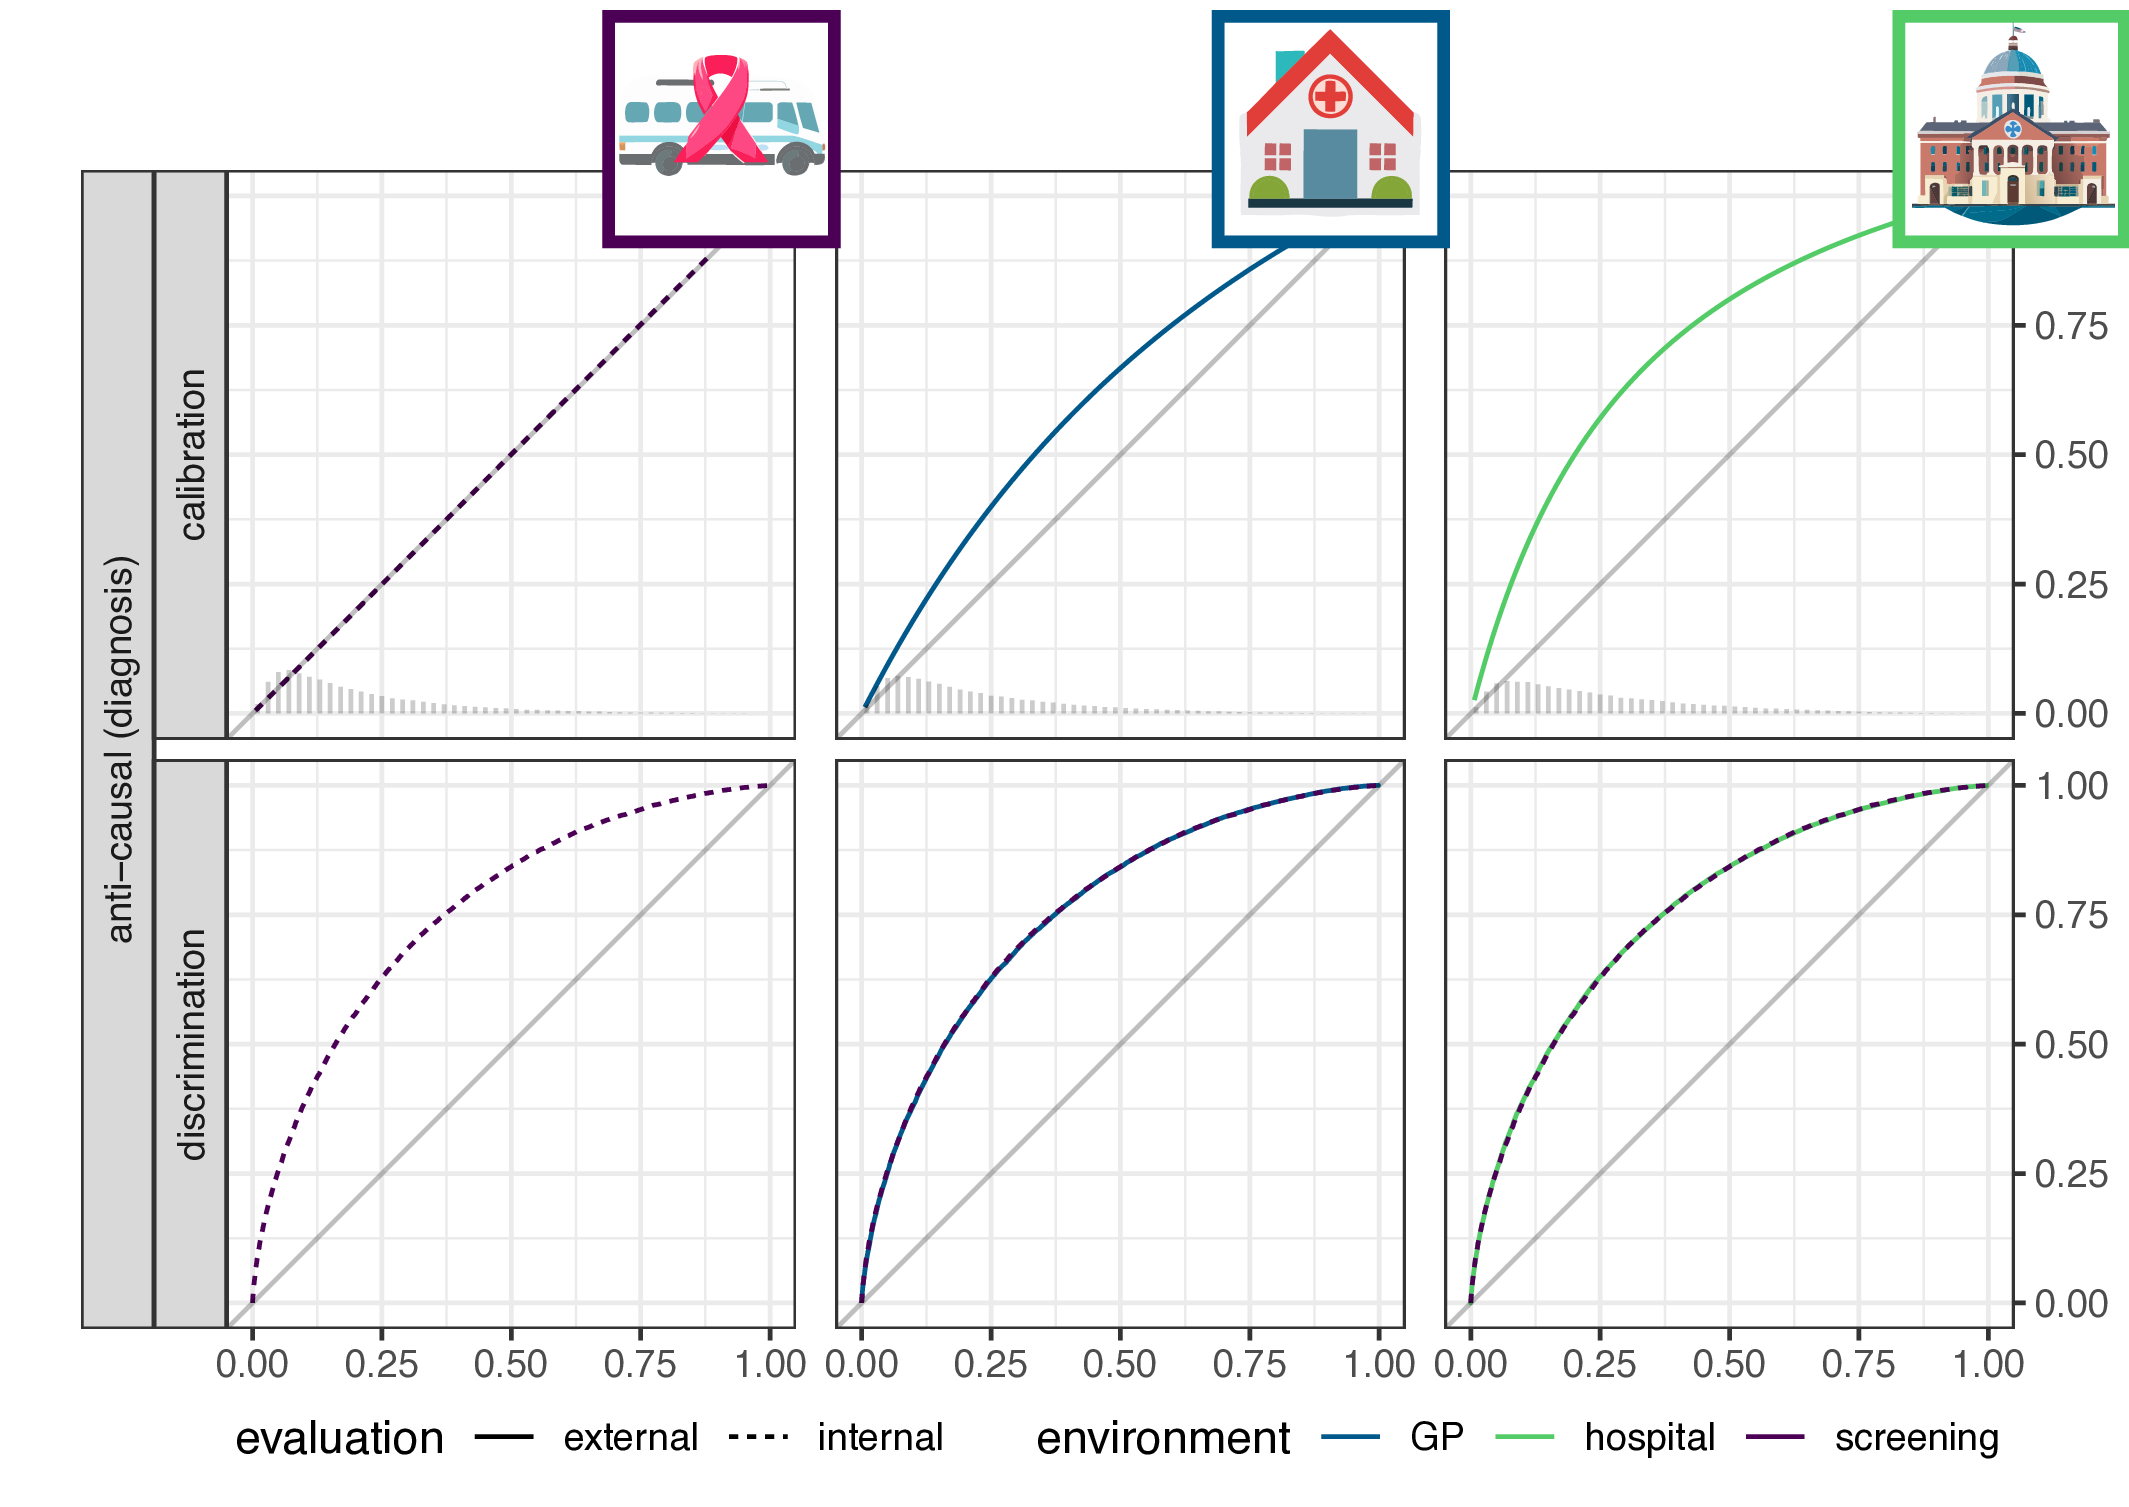
  • for anti-causal (diagnosis) prediction: the reverse
  • main result: discrimination or calibration may be preserved under changes in case-mix, but never both

Why define a shift in case-mix this way?

  1. cause is temporally prior to effect, filtering at least on cause may be likely in many settings
  2. filtering on both: anything goes, cannot say anything about expected performance based on graphical information

Illustrative simulation and empirical evaluation

Simulation setup

\[\begin{align*} \label{eq:dgm-prognosis} \text{prognosis:} & & \text{diagnosis:} & \\ P_y &\sim \text{Beta}(\alpha_e,\beta_e) & y &\sim \text{Bernouli}(P_e) \\ x &= \text{logit}(P_y) & x &\sim N(y, 1) \\ y &\sim \text{Bernoulli}(P_y) & & \end{align*}\]

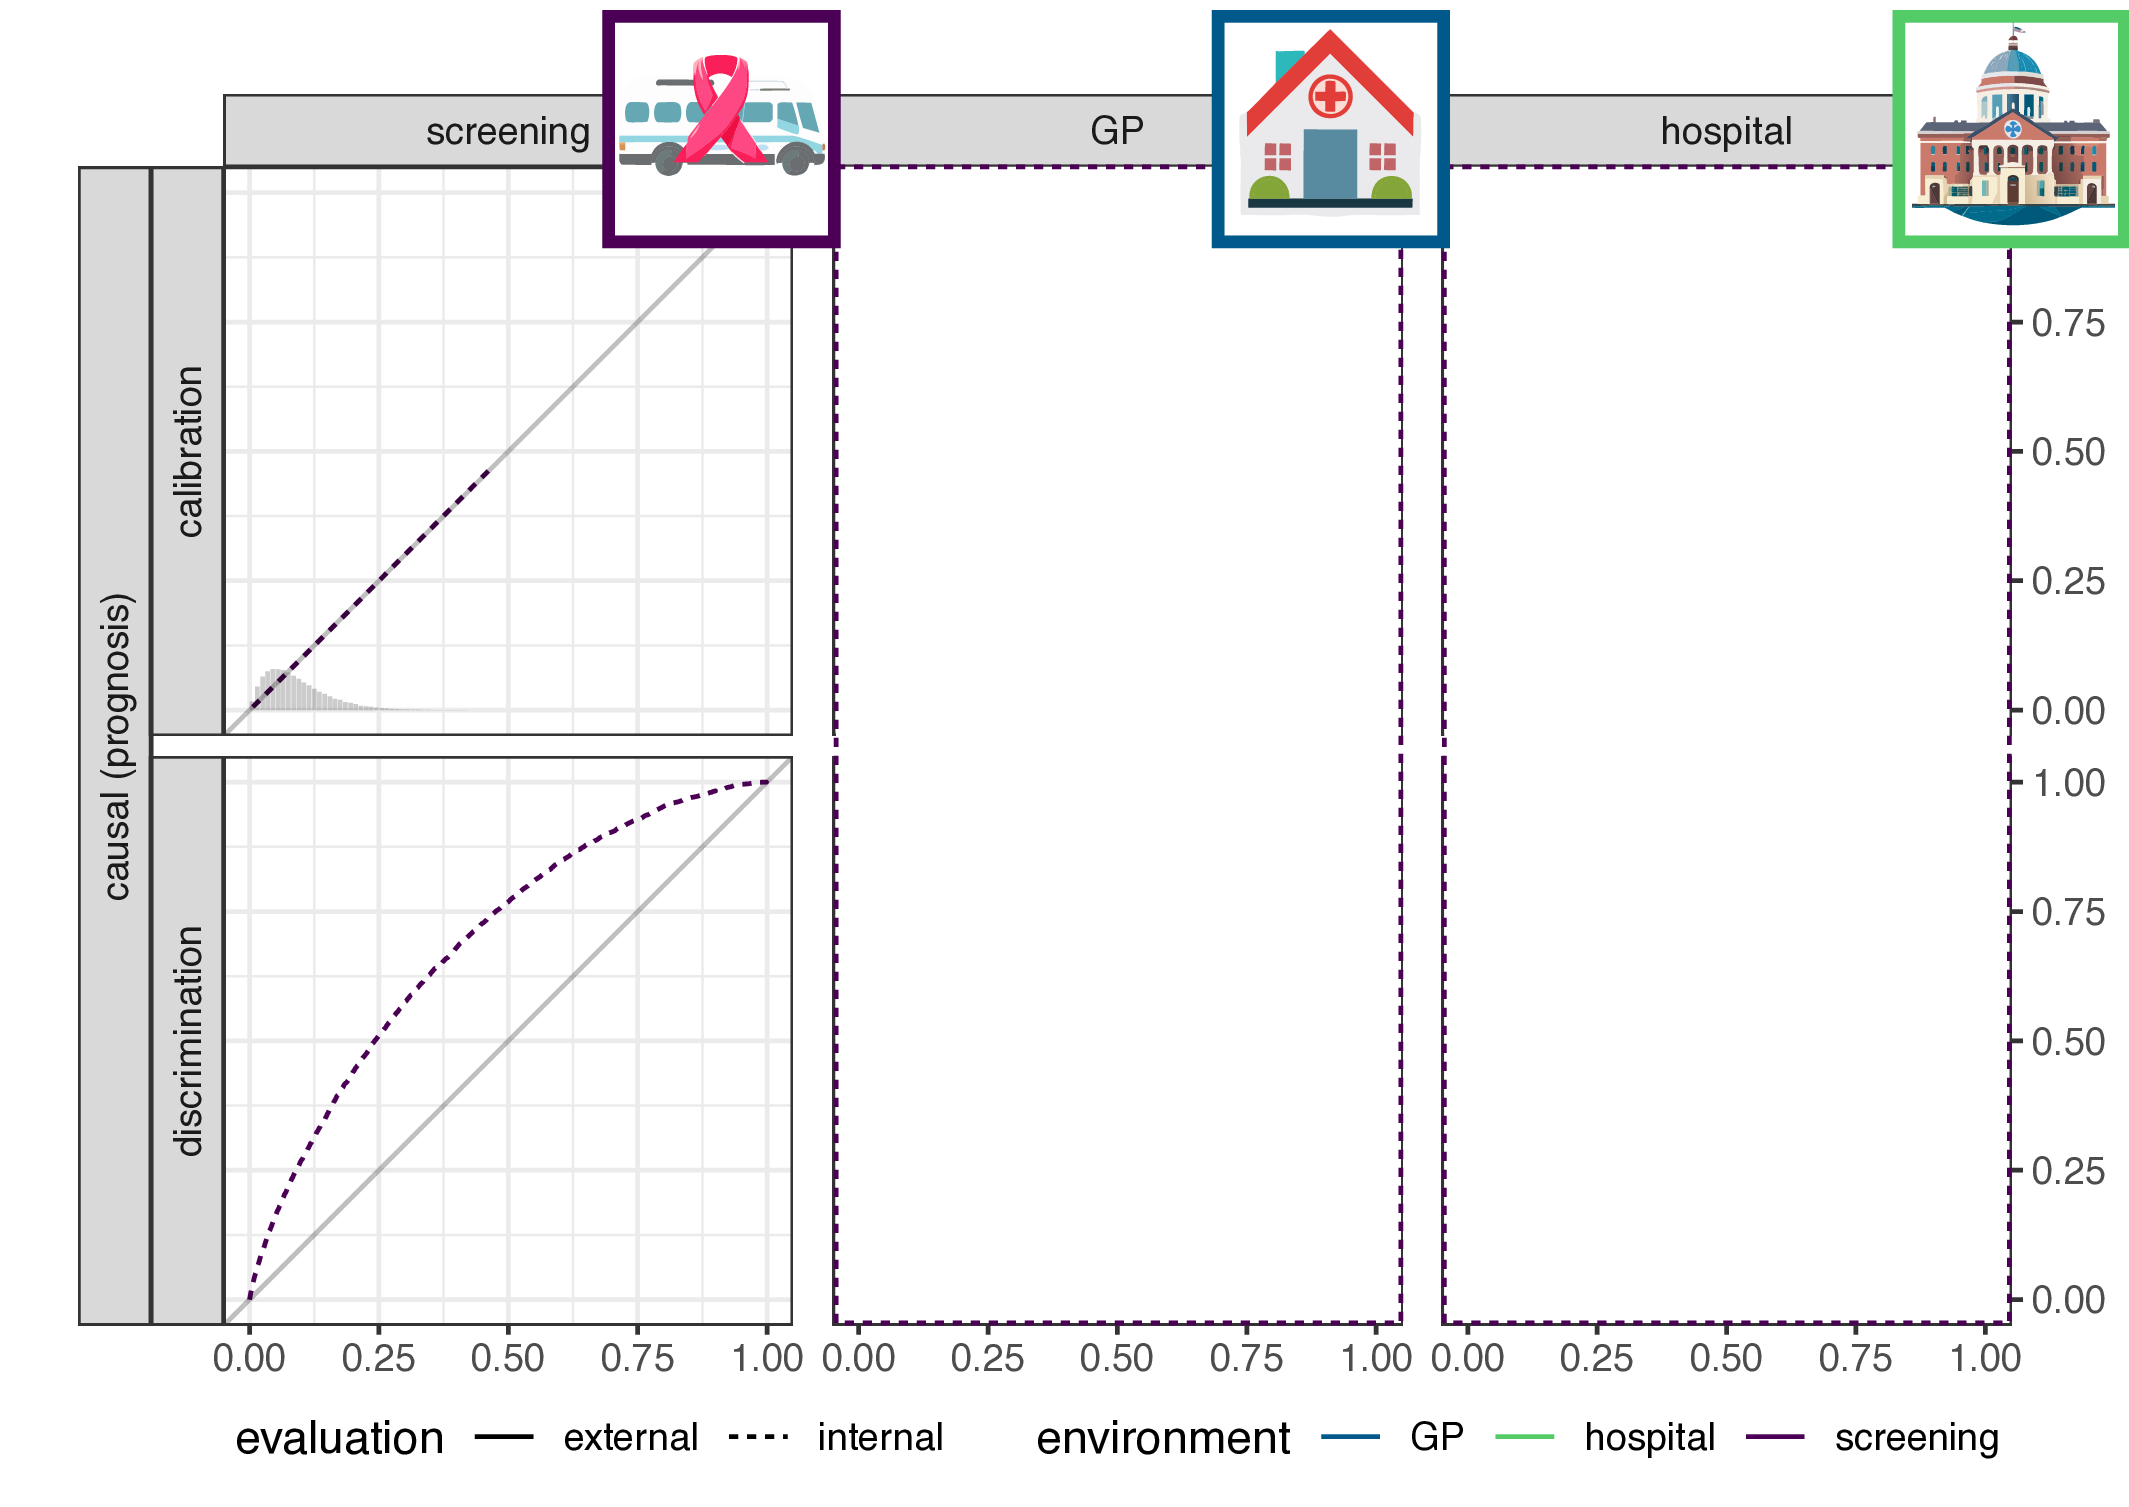
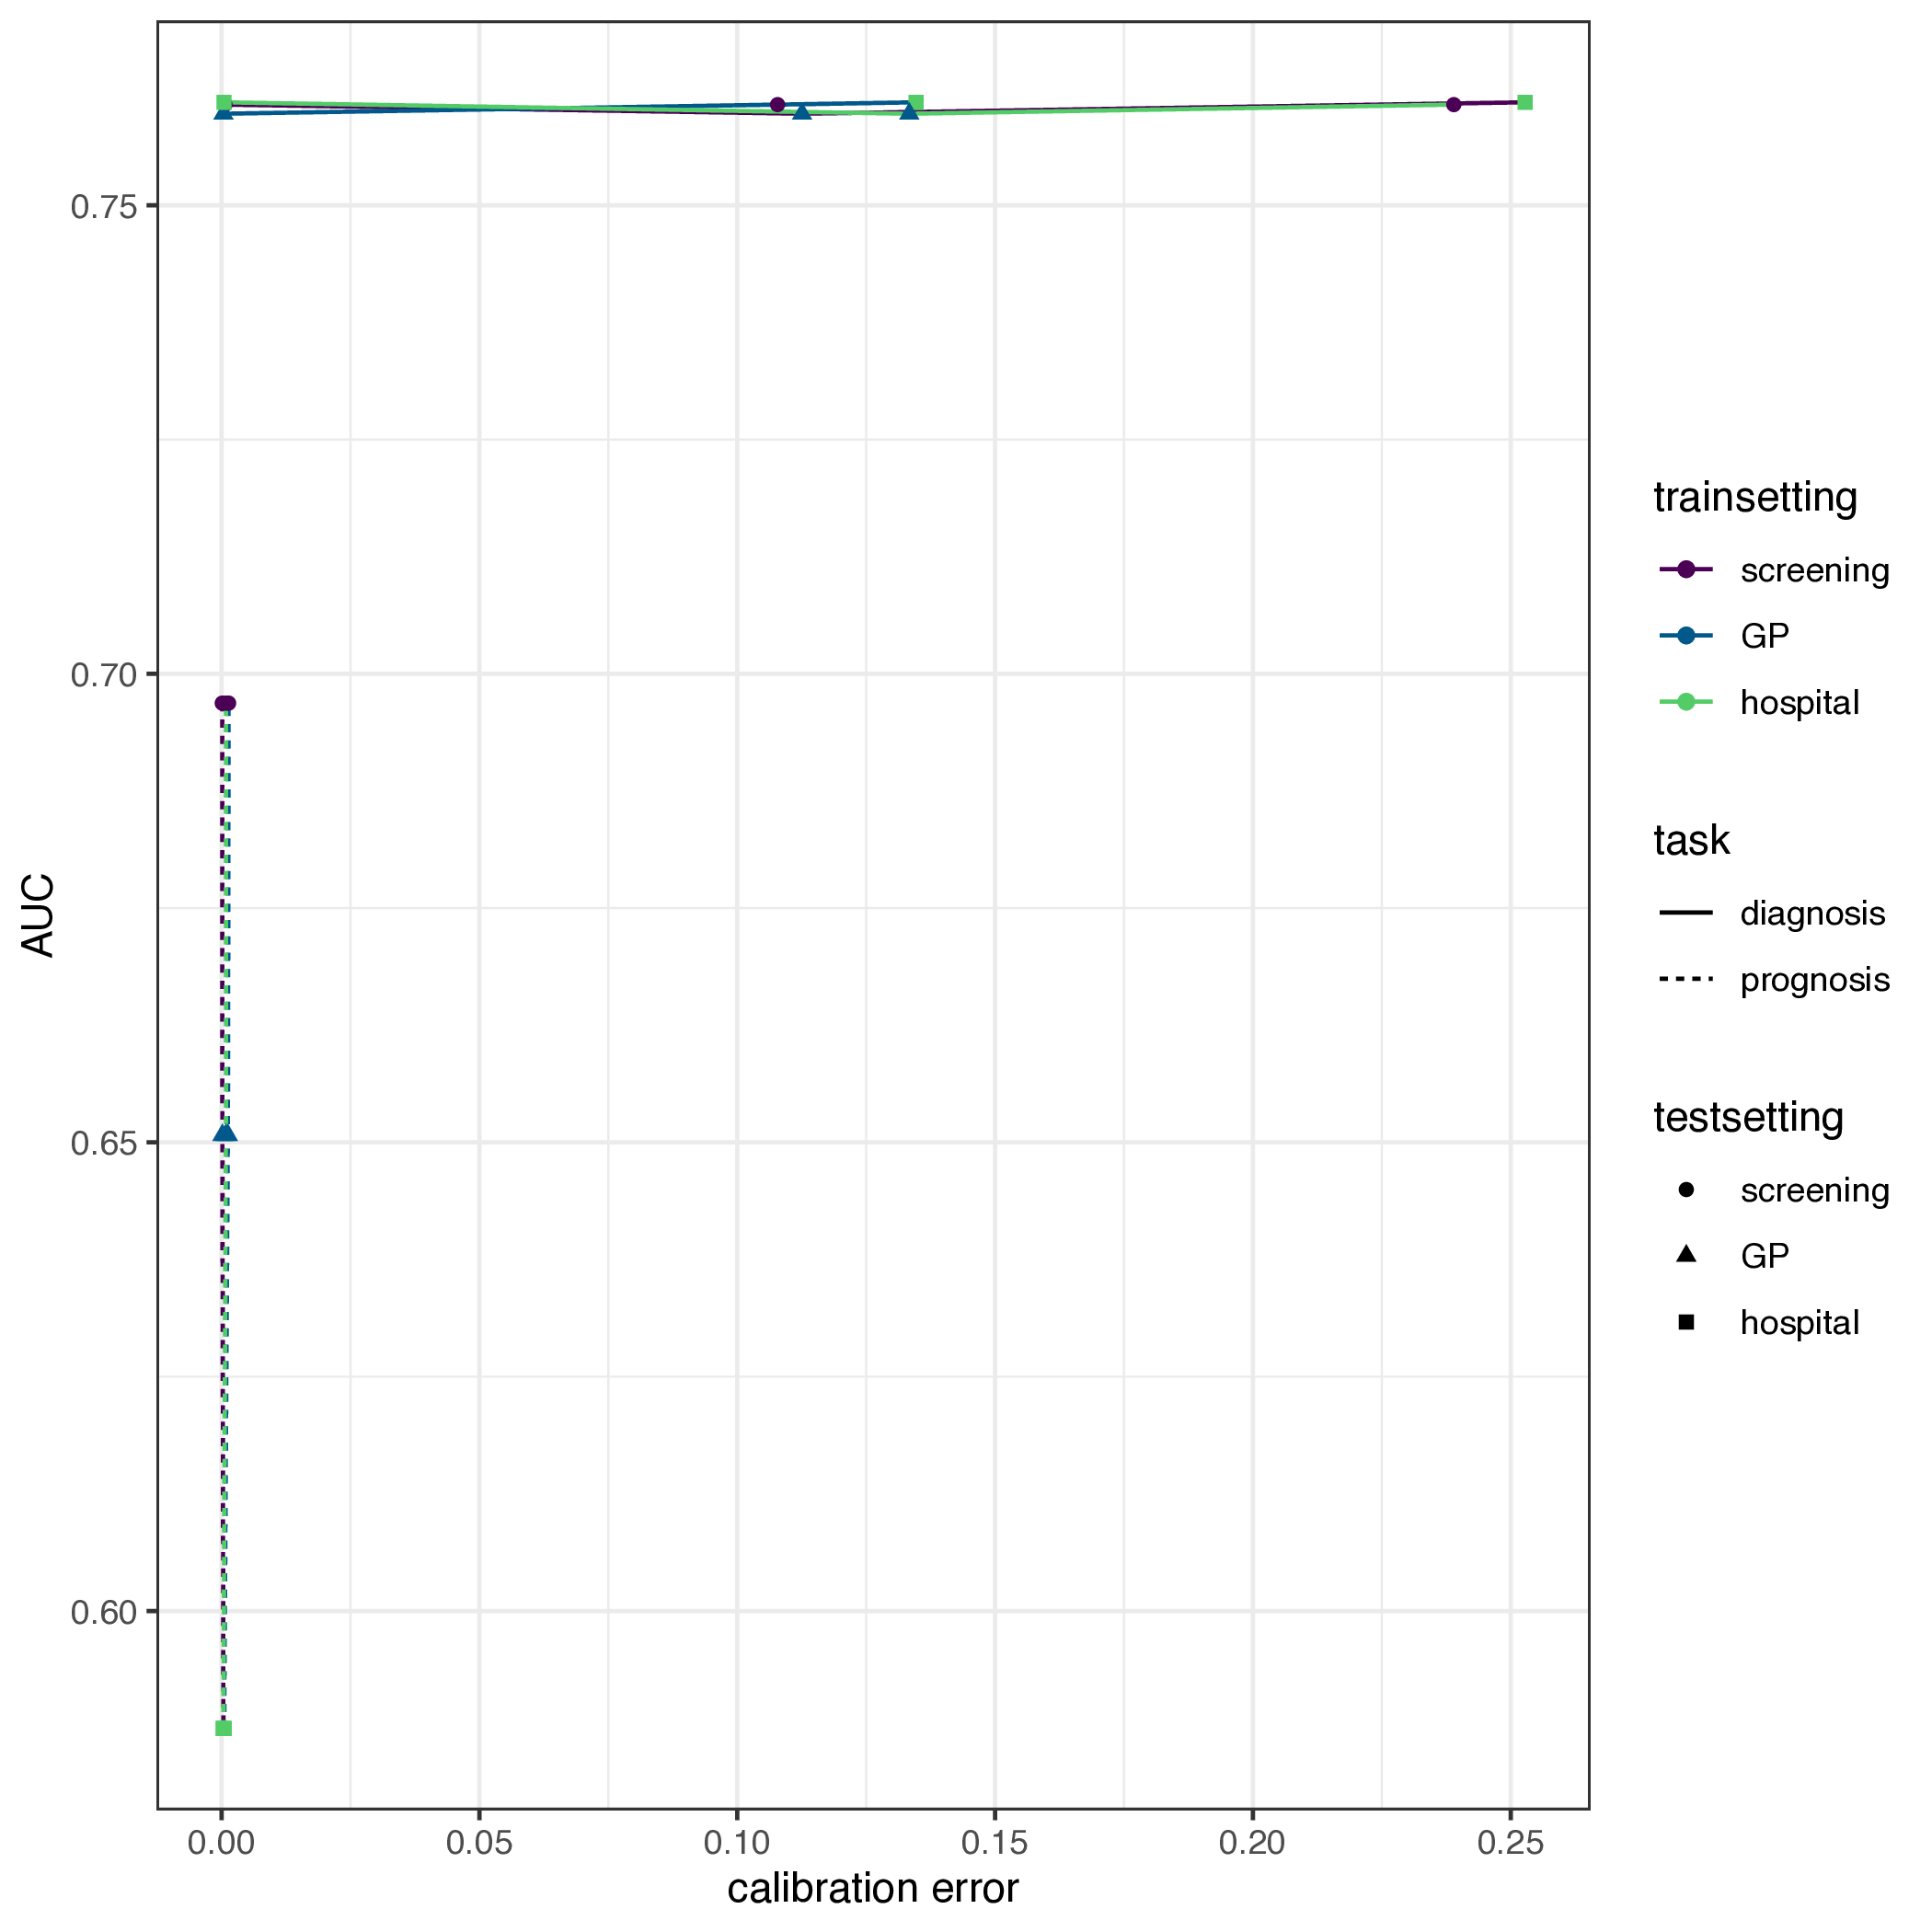
Empirical evaluation

  • registry: all data available with only 4000 clicks
  • solution: scrape the website

Results

  • for each study, extract AUC on internal validation and for each external validation (no calibration data available)
  • calculate scaled deviation from internal AUC (\(\delta\))
  • theory implies:
    • for prognosis models: \(\delta \neq 0\)
    • for diagnostic models: \(\delta=0\)
  • test: variance of \(\delta\) between evaluations of diagnostic or prognostic models (F-test)
  • result: \(\text{VAR}(\delta_{\text{prognostic}}) \approx 8.2 * \text{VAR}(\delta_{\text{diagnostic}}) = 0.019\), p-value\(<0.001\)

Conclusion

  • discrimination: a function of features given outcome
  • calibration: a function of outcome given outcome
  • are we predicting an effect based on its causes (e.g. heart attack, based on cholesterol and age)
  • are we predicting a cause based on its effects (infer presence of CVA based on neurological symptoms)
  • define shift in case-mix as a change in the marginal distribution of the cause variable
  • conclude that in theory:
    • for prognosis models: expect stable calibration, not discrimination
    • for diagnosis models: expect stable discrimination, not calibration
  • illustrated with simulation, evaluated on 2030+ prediction model evaluations, one direction of theory seems confirmed
  • future work: more empirical validations

References

Hond, A. A. H. de. 2023. “From Code to Clinic: Theory and Practice for Artificial Intelligence Prediction Algorithms.” PhD thesis, Leiden University.
Van Calster, Ben, and Andrew J. Vickers. 2015. “Calibration of Risk Prediction Models: Impact on Decision-Analytic Performance.” Medical Decision Making 35 (2): 162–69. https://doi.org/10.1177/0272989X14547233.
Wessler, Benjamin S., Jason Nelson, Jinny G. Park, Hannah McGinnes, Gaurav Gulati, Riley Brazil, Ben Van Calster, et al. 2021. “External Validations of Cardiovascular Clinical Prediction Models: A Large-Scale Review of the Literature.” Circulation: Cardiovascular Quality and Outcomes 14 (8): e007858. https://doi.org/10.1161/CIRCOUTCOMES.121.007858.